
 J.D. Foster
Former Senior Vice President, Economic Policy Division, and Former Chief Economist
Published
November 02, 2018
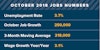
The Bureau of Labor Statistics reported another rock-solid jobs performance for the U.S. economy in October. The quarter million increase in jobs in the employer’s survey was essentially identical to the average performance recorded by the household survey over the past two months. Particularly encouraging is the sustained growth in construction employment, up 330,000 or 4.7% over the past year.
The housing sector has triggered this question ever since housing bubbles popped across the country in 2007 to launch the Great Recession. The question remains as the housing sector is showing distinct signs of slowing. Traditional, convenient explanations, like rising mortgage rates, don’t wash as the current rate on the 30-year fixed rate mortgage is below 2017’s average. So, what is going on with the housing sector?
The initial question during the Great Recession was how far prices would fall. Those were scary days for homeowners and policy makers alike. When prices finally stabilized in most areas by 2012, they had fallen nationally nearly 19 percent according to the Federal Housing Finance Authority’s Housing Price Index, though of course prices fell much further in the most hard-hit neighborhoods and states.
This price decline meant millions of homeowners were far underwater. Underwater homeowners sometimes abandoned properties, leading to further declines in local property values as abandoned properties often went to seed. Underwater owners who stayed were often stuck. They couldn’t sell without taking a bath and often couldn’t sell at all as they didn’t have sufficient assets to pay off the difference between the note’s principal and the house’s new, much lower value.
Stuck and underwater homeowners in turn slowed the recovery because they had to rebuild their own balance sheets and because unemployed workers were geographically anchored. They couldn’t easily move and take a job in another location, thus reducing the U.S. economy of one of its greatest strengths – labor mobility.
As housing markets finally stabilized, prices began to recover. In nominal terms, housing prices today are over 12% higher than they were at their prior peak. However, the general price level over that period has risen nearly 20%, so in inflation-adjusted terms housing prices nationally are still nearly 7% below their previous peak.
While prices recovered more or less as one would expect, home construction didn’t. The value of total residential construction is up sharply since hitting its 2009 low, but the total volume stripped of valuation effects now aligns with the levels achieved in 2004. As the years after 2004 represented the construction side of the housing bubble, the value of current home construction levels would appear to be about right, except for one thing: The value put into every house is itself up sharply.
If we look at housing completions instead of the value of construction, completions of privately-owned have been climbing year by year, and are running at about 1.2 million units annually. Against recent history, this is a very low level, especially after accounting for the usual annual destruction of existing housing stock due to fires, floods, and normal obsolescence. In comparison, in the 1980s annual completions averaged around 1.5 million units, and in the 1990s about 1.3 million units.
The lack of new housing completions has contributed to an extraordinarily tight housing market and, until recently, rising housing prices even after inflation. Rising housing prices would be expected given an overall strong economy and still very low mortgage interest rates. But why, then, aren’t more homes being built?
A dearth of construction workers provided an early explanation. Construction employment nearly halved following the Great Recession and many never returned. However, industries across the country are suffering severe labor shortages, yet manage to grow.
Problems with financing, possibly traceable to the Dodd-Frank financial regulation legislation offer another possible explanation, but so far the supporting evidence for a substantial effect is lacking.
Even though prices nationally have more than fully recovered, perhaps the answer to the housing supply conundrum still lies with prices. The chart below shows the trajectory of inflation-adjusted housing prices since 1976 in orange. The blue line shows a stabilized housing price path assuming housing prices rise on average 0.35% more than underlying inflation.
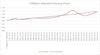
The two lines track well through about 2000, then the housing bubble builds through 2007 and then prices collapse, stabilize around 2012, and then begin the road to recovery. Notice that actual inflation-adjusted prices are just now reaching the earlier trajectory. It could be that the supply response and resulting leveling off of housing price inflation won’t start until the lines cross signaling a fully normalized housing market. If so, then we have a proximate answer to the question – what’s going on with housing?
But it’s not a complete answer. First, the assumption that real housing prices would rise by 0.35% a year is chosen just to fit the graph. The correct figure could be well below or well above that level. Second, why should real housing prices increase relentlessly over decades?
The housing sector is vital to the U.S. economy and its health is vital to the financial security of millions of Americans. Could part of the explanation for the sector’s curious performance be that prices nationally are just now approaching normal?
About the authors
J.D. Foster
Dr. J.D. Foster is the former senior vice president, Economic Policy Division, and former chief economist at the U.S. Chamber of Commerce. He explores and explains developments in the U.S. and global economies.