
Former Senior Economist, Regulatory Analysis, U.S. Chamber of Commerce
Published
January 08, 2020
Welcome to the U.S. Chamber of Commerce’s Monthly Workforce Monitor: Worker Availability Report — an analysis of the state of the U.S. job market and worker availability.
The U.S. labor market continued to tighten in October as the Worker Availability Ratio fell to the lowest level recorded in the nearly 20-year history of the data series: 0.88, less than one available worker per job opening. The October ratio of 0.88 workers per job opening is down from the September ratio of 0.95 workers per available job. The monthly ratio has fallen from the record high of 7.99 in December 2010 and has averaged 2.84 over the history of the series since January 2001.
The Worker Availability Ratio compares Available Workers (persons who want a job and are available to work now) as reported from the Bureau of Labor Statistics (BLS) monthly Employment Situation Report household survey of individuals to employers’ Job Openings as reported from the BLS Job Openings and Labor Turnover Survey (JOLTS).
The nationwide estimate of job openings in October was 7.63 million compared to 6.74 million available workers. Job openings rose by over 500,000 in October compared to September, while the number of available workers was essentially unchanged. The October Worker Availability Ratio of 0.88 is the result of dividing 6.74 million total available workers by 7.63 million job openings in October.
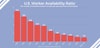
The twelve-month moving average for the Worker Availability Ratio was 1.031 in October, continuing a gradual downward trend for the year. The 12-month moving average smooths seasonal and sampling variations. The October moving average mark at 1.031 is the lowest recorded in the 19-year history of the data series.
Regional Worker Availability
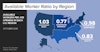
October job openings, available workers and the corresponding Worker Availability Ratio vary across the four major Census regions: The lowest regional ratio for October was 0.77 for the Midwest, and the highest was 1.03 for the West. The October ratios were 0.83 for the South and 0.98 for the Northeast.
- The Worker Availability Ratio for the Northeast region at 0.98 in October was a decrease from 1.01 in September. The 1.259 million available workers in the region reflected a combination of 1.051 million active job seekers and 207,500 available workers who had not actively searched in the previous month. The number of available workers was little changed from September. Job openings in the region totaled 1.286 million in October, also little changed from September. Both job openings and available worker numbers are reported on a non-seasonally adjusted basis.
- The Worker Availability Ratio for the Midwest region was 0.77 in October, a decrease from 0.91 in September. The 1.372 million available workers in the region reflected a combination of 1.105 million active job seekers and 266,000 available workers who had not actively searched in the previous month. Available workers declined only slightly from September, but job openings in the region increased significantly over the month by 219,000 to an October total of 1.771 million.
- The Worker Availability Ratio for the South region was 0.83 available workers per job opening in October, a decrease from 0.92 in September. The 2.408 million available workers in the region reflected a combination of 1.964 million active job seekers and 444,000 available workers who had not actively searched in the previous month. The total number of available workers was down little from September, but job openings in the South increased by 240,000 in October, for a total of 2.916 million.
- The Worker Availability Ratio for the West region was 1.03 available workers per job opening in October, up slightly from 1.01 in September. The West was the only region in which the ratio did not decline in October. Job Openings for the region were 1.653 million in October, essentially unchanged from the 1.628 million openings estimated for September by the BLS JOLTS survey. Available workers in the West totaled 1.704 million in October, an increase of 68,000 from September – resulting in a combination of 1.359 million active job seekers and 315,000 who had not actively searched in the previous month.
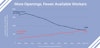
For the first time, the U.S. Chamber has expanded this analysis to include a state-by-state Workforce Availability Ratio report. Our analysis shows a varying but universally significant workforce shortage challenge in every state across the country, with no state averaging a monthly WAR ratio of more than 1.5 available workers for every open job (Louisiana) during the most recent 12 months of available data.
North Dakota had the fewest available workers per opening during that period (July 2018 – June 2019), with barely one worker available for every two job openings (0.51). In 10 states – Iowa, Kansas, Minnesota, Missouri, New Hampshire, North Dakota, South Dakota, Utah, Vermont, and Wisconsin – there were fewer than three workers available for every four open jobs.
In fact, more than half of states (28) have more open jobs than available workers to fill them. Hypothetically, this means that even if every single individual in that state who wants a job – and is available to work – could find a job, there would still be positions left unfilled.
Click here to view the full state-by-state report.
Analysis and Context
The Worker Availability Ratio is continuing evidence of historically tight labor market conditions over the past year and a significant “people gap” challenge with regard to the American workforce.
Developed by the U.S. Chamber of Commerce, the Worker Availability Ratio measures the number of available workers for every job opening. For our calculations, the total 6.7 million available workers in October 2019 included 5.5 million “active job seekers” (corresponding to the Bureau of Labor Statistics’ [BLS] definition of unemployed persons) and 1.2 million others whom the BLS classifies as not in the labor force but “marginally attached;” that is, they want jobs, they are available to begin work immediately, and they have looked for work in the past year, though they have not actively looked for work in the most recent month. Data reported here are not seasonally adjusted. If the final October job openings estimate is revised upward, the final ratio will be lower. There was no significant revision to the preliminary September job openings estimate.
The Worker Availability Ratio has changed significantly over the past decade. Ten years ago, there were approximately eight workers available for each open job. Over the almost 20-year history of available data, there have been an average of 2.9 workers for each open position. Now there is less than one worker available per job opening nationwide and in three of four national regions. Employers looking to fill open positions are experiencing a labor market that’s nearly three times tighter than it has been on average over the last two decades and eight times tighter than it was 10 years ago.
In our dynamic labor market, workers are continually shifting between jobs or moving in and out of the market. For employers, jobs are continually being filled as new ones open up. Consequently, the individuals available for work and the jobs open are not the same from one month to the next, but the trend toward fewer available workers relative to the rising number of job openings shows, in broad terms, the increasing tightness of the labor market.
Of course, available workers vary in terms of experience, skills, and location, so they may not match the occupational, skill, location, and other needs associated with job openings. This “mismatch” problem becomes especially critical when the Worker Availability Ratio is relatively low, as it is currently.
The data draw attention to an important but overshadowed “gap” in the American workforce. While much attention has been given to the skills gap — that is, that too many people lack the skills they need to compete for jobs in today’s economy — our nation also faces a growing people gap. In other words, there simply are too few workers relative to the demand.
To learn more about how the U.S. Chamber and the U.S. Chamber of Commerce Foundation are working to close the gaps in the American workforce, visit our Center for Education and Workforce.
Click here for the full methodology and source information.
About the author
Ronald Bird
Bird is a former senior economist specializing in regulatory economics at the Chamber. His work includes analyzing and evaluating estimates of regulations’ costs and benefits produced by the government to identify significant errors and omissions.


