The September 2025 report, Beyond the Payoff: How Investments in Resilience and Disaster Preparedness Protect Communities, reveals that higher levels of investment in disaster resilience and preparedness can significantly reduce the economic toll of disasters.
Developed in partnership between the U.S. Chamber of Commerce, the U.S. Chamber Foundation and Allstate, that report shows how every dollar not invested today could result in lost future economic activity.
Key findings include:
- Every dollar not invested today results in an average of $22.60 in lost future economic activity across all disaster types.
- In some cases, the cost climbs even higher, with some communities facing potential losses of more than $30 for every dollar not spent on preparedness.
- Lower resilience and preparedness funding leads to significantly higher long-term costs.
The study modeled four future disaster preparedness investment scenarios spanning from high resilience investment to limited investment to show how different funding levels can shape a community’s economic future. Using the report’s methodology, the research that follows shows the potential economic cost savings for the Mobile, Alabama region.
In Mobile, every $1 invested in resilience and preparedness reduces economic costs by more than $14 compared to a scenario with decreased investment.
When factoring in damage and cleanup savings, each $1 invested yields more than $20 in total savings.
It’s important to note that the ratio depends on several factors:
- The size of the disaster
- The investment needed to cut the damage in half
- The resulting economic impact
Different disasters in different locations will yield different savings ratios.
Disaster Resilience in Mobile
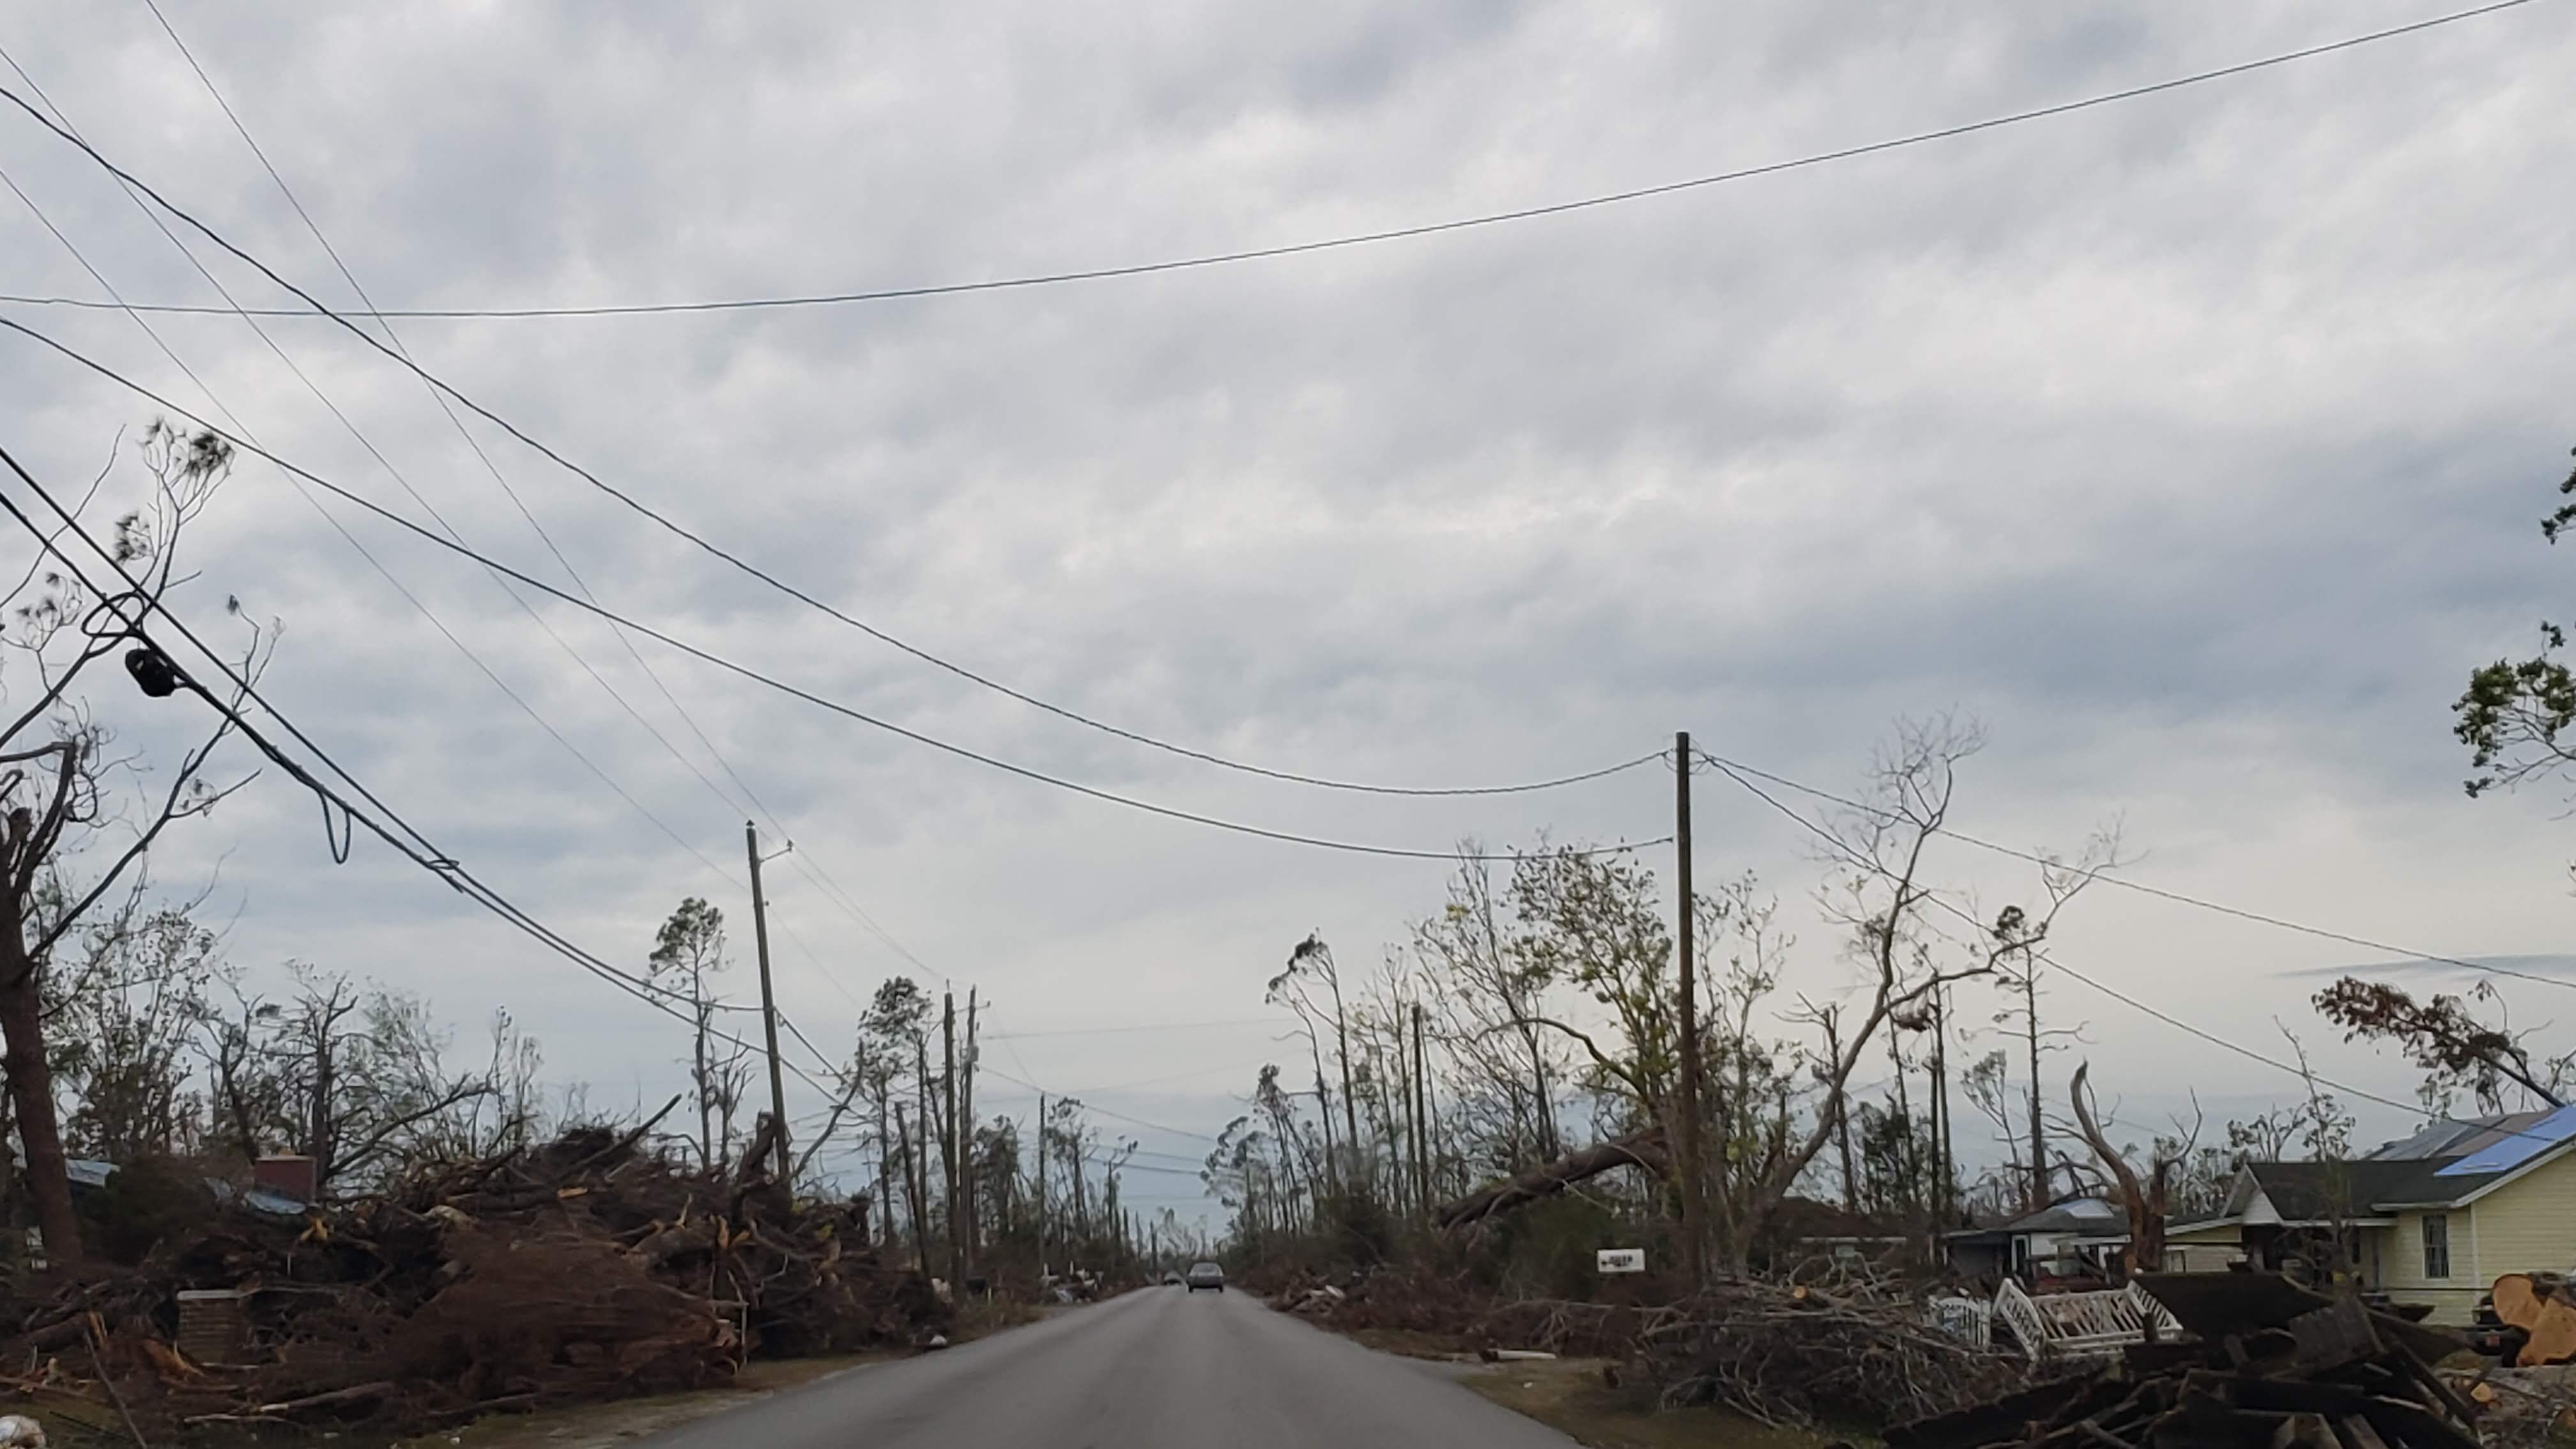
Mobile’s geography makes it especially vulnerable to hurricanes and flooding. The region is seeing more frequent and severe storms, which strain local resources and the economy.
Flooding poses immediate risks, which include damage to infrastructure, drowning, injury, and exposure to household or industrial chemicals, germs in the water, and contaminated drinking water. Over the long term, flooding has been linked to higher death rates from cardiovascular disease, infectious and parasitic illnesses, injuries, and respiratory conditions.
In 2023, the City of Mobile published a Resilience Assessment tool to establish a baseline understanding of the community’s ability to withstand and adapt to future challenges. The city and its partners are leading a collaborative planning process to identify actionable steps that will help Mobile remain a great place to live, work, and raise a family.
This process includes holding working sessions with city leadership, city staff, approximately 60 stakeholders and subject-matter experts across four advisory groups, and the public. The resulting City-Wide Resilience Plan will serve as a roadmap, outlining timelines, partners, funding, and implementation strategies.
It is vital that community members, small business owners, and decision-makers understand how resilience and preparedness investments can reduce the economic toll of disasters.
The scenario modeled below highlights the jobs saved, workforce preserved, and economic savings that come from those investments.
Costs of a Storm with Flooding in the Mobile Area
Every $1 not invested in storm preparedness spending results in more than $14 in lost future economic activity.
In Scenario 1 (high investment), where investment is high enough to cut damages from a $1 billion storm with flooding occurring in 2035 by half, Mobile and its region would experience the following impacts:
- More than 800 lost jobs
- Over 200 people leaving the area permanently
- Local GDP declining by $120 million.
However, in Scenario 4 (limited investment)—where investment falls by just $1 million over 10 years (or $100,000 annually)—the economic toll more than doubles:
- Job losses exceed 1,800
- Almost 600 people relocate permanently
- Local GDP drops by approximately $280 million
Investing more reduces the damage from a $1 billion disaster in Mobile
Chart shows investment or losses over 10 years
| | Scenario 1 | Scenario 2 | Scenario 3 | Scenario 4 |
|---|---|---|---|---|
| Invested or Cut | $102 million | $50 million | No Change | (-) $1 million |
| Jobs Lost | -842 | -1284 | -1637 | -1856 |
| Population Lost | -229 | -392 | -526 | -596 |
| GDP Lost | -$120,000,000 | -$190,000,000 | -$240,000,000 | -$280,000,000 |
| Ratio of Savings vs. Investment | NA | $7.12 | $7.16 | $14.17 |
| Job Gains from Investment or Losses | 45 | 22 | NA | -1 |
| GDP Gains from Investment or Losses | $7,000,000 | $2,360,681 | NA | -$100,000 |
Compared to Scenario 1, this means an additional 1,000 jobs lost, 400 more people displaced, and $160 million in GDP losses. These figures do not include the billions of dollars in infrastructure damage and cleanup costs that also follow a major flood.
Scenarios 2 and 3, which model moderate and current investment levels, also reduce long-term economic losses, but not as significantly as Scenario 1. These comparisons are seen in the table.
Overall, the data shows that a community could incur a cost of $14 for every dollar not invested in disaster resilience. See the Methodology for a detailed breakdown of this calculation.
Methodology, recommendations for communities, and additional disaster scenarios are available here. The Beyond the Payoff study builds on research first published in the June 2024 study, The Preparedness Payoff.
Report prepared in partnership with: