Stephanie Ferguson Melhorn
Executive Director, Workforce & International Labor Policy, U.S. Chamber of Commerce
Published
February 02, 2024
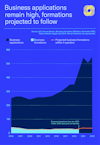
Entrepreneurship is booming in the United States. Over the last few years, the number of applications filed to start new businesses has surged. Application numbers doubled in 2020 compared to recent years, and 2021 and 2022 saw over 5 million applications filed, according to the U.S. Census Bureau.
The trend only accelerated in 2023, with a record-breaking 5.5 million new business applications filed. Explore the data below to understand the new business formation trends across the nation and in your state.
For each state, the interactive map below tracks:
- Percent change of new business applications between December 2022 and December 2023
- Number of new business applications filed in 2023
- State’s ranking of business applications per capita in each state
- The projected business formations within four quarters
- Percentage of applications projected to become employer businesses
- The congressional district(s) with the highest number of new business applications
Join the U.S. Chamber of Commerce and gain access to exclusive resources, expert insights, and a powerful network dedicated to helping your business thrive. Together, we’ll tackle challenges, drive growth, and amplify your voice in Washington and beyond.
New Business Applications by State
Click on a state for more details.
Alabama
-
0.5%
The percentage change of new business applications filed in December 2023 compared to December 2022
-
71,835
New business applications in 2023
-
#26
Ranking of 2023 business applications per capita
-
4,222
2023 projected business formations within 4 quarters
-
5.9%
Percent of applications projected to become an employer business
Alaska
-
-1.8%
The percentage change of new business applications filed in December 2023 compared to December 2022
-
8,929
New business applications in 2023
-
#33
Ranking of 2023 business applications per capita
-
795
2023 projected business formations within 4 quarters
-
8.9%
Percent of applications projected to become an employer business
Arizona
-
5.3%
The percentage change of new business applications filed in December 2023 compared to December 2022
-
125,822
New business applications in 2023
-
#15
Ranking of 2023 business applications per capita
-
7,895
2023 projected business formations within 4 quarters
-
6.3%
Percent of applications projected to become an employer business
Arkansas
-
1.8%
The percentage change of new business applications filed in December 2023 compared to December 2022
-
39,048
New business applications in 2023
-
#34
Ranking of 2023 business applications per capita
-
2,764
2023 projected business formations within 4 quarters
-
7.1%
Percent of applications projected to become an employer business
California
-
7.8%
The percentage change of new business applications filed in December 2023 compared to December 2022
-
558,011
New business applications in 2023
-
#25
Ranking of 2023 business applications per capita
-
51,568
2023 projected business formations within 4 quarters
-
9.2%
Percent of applications projected to become an employer business
Colorado
-
115.0%
The percentage change of new business applications filed in December 2023 compared to December 2022
-
142,927
New business applications in 2023
-
#5
Ranking of 2023 business applications per capita
-
7,930
2023 projected business formations within 4 quarters
-
5.5%
Percent of applications projected to become an employer business
Connecticut
-
10.2%
The percentage change of new business applications filed in December 2023 compared to December 2022
-
48,373
New business applications in 2023
-
#31
Ranking of 2023 business applications per capita
-
3,003
2023 projected business formations within 4 quarters
-
6.2%
Percent of applications projected to become an employer business
Delaware
-
19.3%
The percentage change of new business applications filed in December 2023 compared to December 2022
-
55,389
New business applications in 2023
-
#2
Ranking of 2023 business applications per capita
-
2,294
2023 projected business formations within 4 quarters
-
4.1%
Percent of applications projected to become an employer business
District of Columbia
-
-5.6%
The percentage change of new business applications filed in December 2023 compared to December 2022
-
14,831
New business applications in 2023
-
#7
Ranking of 2023 business applications per capita
-
589
2023 projected business formations within 4 quarters
-
4.0%
Percent of applications projected to become an employer business
Florida
-
-3.0%
The percentage change of new business applications filed in December 2023 compared to December 2022
-
667,031
New business applications in 2023
-
#3
Ranking of 2023 business applications per capita
-
32,523
2023 projected business formations within 4 quarters
-
4.9%
Percent of applications projected to become an employer business
Georgia
-
-9.9%
The percentage change of new business applications filed in December 2023 compared to December 2022
-
277,626
New business applications in 2023
-
#4
Ranking of 2023 business applications per capita
-
12,456
2023 projected business formations within 4 quarters
-
4.5%
Percent of applications projected to become an employer business
Hawaii
-
6.1%
The percentage change of new business applications filed in December 2023 compared to December 2022
-
19,159
New business applications in 2023
-
#29
Ranking of 2023 business applications per capita
-
895
2023 projected business formations within 4 quarters
-
4.7%
Percent of applications projected to become an employer business
Idaho
-
10.1%
The percentage change of new business applications filed in December 2023 compared to December 2022
-
31,338
New business applications in 2023
-
#17
Ranking of 2023 business applications per capita
-
2,978
2023 projected business formations within 4 quarters
-
9.5%
Percent of applications projected to become an employer business
Illinois
-
12.0%
The percentage change of new business applications filed in December 2023 compared to December 2022
-
174,667
New business applications in 2023
-
#27
Ranking of 2023 business applications per capita
-
10,880
2023 projected business formations within 4 quarters
-
6.2%
Percent of applications projected to become an employer business
Indiana
-
13.0%
The percentage change of new business applications filed in December 2023 compared to December 2022
-
94,057
New business applications in 2023
-
#28
Ranking of 2023 business applications per capita
-
5,905
2023 projected business formations within 4 quarters
-
6.3%
Percent of applications projected to become an employer business
Iowa
-
33.7%
The percentage change of new business applications filed in December 2023 compared to December 2022
-
33,444
New business applications in 2023
-
#48
Ranking of 2023 business applications per capita
-
2,717
2023 projected business formations within 4 quarters
-
8.1%
Percent of applications projected to become an employer business
Kansas
-
8.7%
The percentage change of new business applications filed in December 2023 compared to December 2022
-
33,268
New business applications in 2023
-
#42
Ranking of 2023 business applications per capita
-
2,659
2023 projected business formations within 4 quarters
-
8.0%
Percent of applications projected to become an employer business
Kentucky
-
20.0%
The percentage change of new business applications filed in December 2023 compared to December 2022
-
55,265
New business applications in 2023
-
#37
Ranking of 2023 business applications per capita
-
3,626
2023 projected business formations within 4 quarters
-
6.6%
Percent of applications projected to become an employer business
Louisiana
-
-8.6%
The percentage change of new business applications filed in December 2023 compared to December 2022
-
80,457
New business applications in 2023
-
#11
Ranking of 2023 business applications per capita
-
3,149
2023 projected business formations within 4 quarters
-
3.9%
Percent of applications projected to become an employer business
Maine
-
26.8%
The percentage change of new business applications filed in December 2023 compared to December 2022
-
14,086
New business applications in 2023
-
#50
Ranking of 2023 business applications per capita
-
1,601
2023 projected business formations within 4 quarters
-
11.4%
Percent of applications projected to become an employer business
Maryland
-
0.5%
The percentage change of new business applications filed in December 2023 compared to December 2022
-
101,704
New business applications in 2023
-
#16
Ranking of 2023 business applications per capita
-
4,623
2023 projected business formations within 4 quarters
-
4.5%
Percent of applications projected to become an employer business
Massachusetts
-
7.0%
The percentage change of new business applications filed in December 2023 compared to December 2022
-
76,375
New business applications in 2023
-
#47
Ranking of 2023 business applications per capita
-
7,078
2023 projected business formations within 4 quarters
-
9.3%
Percent of applications projected to become an employer business
Michigan
-
-2.6%
The percentage change of new business applications filed in December 2023 compared to December 2022
-
148,508
New business applications in 2023
-
#24
Ranking of 2023 business applications per capita
-
7,445
2023 projected business formations within 4 quarters
-
5.0%
Percent of applications projected to become an employer business
Minnesota
-
26.3%
The percentage change of new business applications filed in December 2023 compared to December 2022
-
69,210
New business applications in 2023
-
#39
Ranking of 2023 business applications per capita
-
4,898
2023 projected business formations within 4 quarters
-
7.1%
Percent of applications projected to become an employer business
Mississippi
-
-6.4%
The percentage change of new business applications filed in December 2023 compared to December 2022
-
53,237
New business applications in 2023
-
#10
Ranking of 2023 business applications per capita
-
2,287
2023 projected business formations within 4 quarters
-
4.3%
Percent of applications projected to become an employer business
Missouri
-
11.7%
The percentage change of new business applications filed in December 2023 compared to December 2022
-
90,384
New business applications in 2023
-
#23
Ranking of 2023 business applications per capita
-
6,055
2023 projected business formations within 4 quarters
-
6.7%
Percent of applications projected to become an employer business
Montana
-
29.5%
The percentage change of new business applications filed in December 2023 compared to December 2022
-
23,789
New business applications in 2023
-
#8
Ranking of 2023 business applications per capita
-
1,855
2023 projected business formations within 4 quarters
-
7.8%
Percent of applications projected to become an employer business
Nebraska
-
11.5%
The percentage change of new business applications filed in December 2023 compared to December 2022
-
21,574
New business applications in 2023
-
#43
Ranking of 2023 business applications per capita
-
2,124
2023 projected business formations within 4 quarters
-
9.8%
Percent of applications projected to become an employer business
Nevada
-
0.6%
The percentage change of new business applications filed in December 2023 compared to December 2022
-
65,986
New business applications in 2023
-
#9
Ranking of 2023 business applications per capita
-
4,520
2023 projected business formations within 4 quarters
-
6.8%
Percent of applications projected to become an employer business
New Hampshire
-
10.1%
The percentage change of new business applications filed in December 2023 compared to December 2022
-
16,179
New business applications in 2023
-
#44
Ranking of 2023 business applications per capita
-
1,419
2023 projected business formations within 4 quarters
-
8.8%
Percent of applications projected to become an employer business
New Jersey
-
-1.0%
The percentage change of new business applications filed in December 2023 compared to December 2022
-
160,996
New business applications in 2023
-
#12
Ranking of 2023 business applications per capita
-
9,188
2023 projected business formations within 4 quarters
-
5.7%
Percent of applications projected to become an employer business
New Mexico
-
20.4%
The percentage change of new business applications filed in December 2023 compared to December 2022
-
33,865
New business applications in 2023
-
#18
Ranking of 2023 business applications per capita
-
1,760
2023 projected business formations within 4 quarters
-
5.2%
Percent of applications projected to become an employer business
New York
-
8.1%
The percentage change of new business applications filed in December 2023 compared to December 2022
-
313,481
New business applications in 2023
-
#20
Ranking of 2023 business applications per capita
-
22,638
2023 projected business formations within 4 quarters
-
7.2%
Percent of applications projected to become an employer business
North Carolina
-
6.5%
The percentage change of new business applications filed in December 2023 compared to December 2022
-
170,924
New business applications in 2023
-
#19
Ranking of 2023 business applications per capita
-
11,976
2023 projected business formations within 4 quarters
-
7.0%
Percent of applications projected to become an employer business
North Dakota
-
37.7%
The percentage change of new business applications filed in December 2023 compared to December 2022
-
8,960
New business applications in 2023
-
#40
Ranking of 2023 business applications per capita
-
901
2023 projected business formations within 4 quarters
-
10.1%
Percent of applications projected to become an employer business
Ohio
-
1.9%
The percentage change of new business applications filed in December 2023 compared to December 2022
-
148,623
New business applications in 2023
-
#36
Ranking of 2023 business applications per capita
-
7,816
2023 projected business formations within 4 quarters
-
5.3%
Percent of applications projected to become an employer business
Oklahoma
-
10.9%
The percentage change of new business applications filed in December 2023 compared to December 2022
-
58,195
New business applications in 2023
-
#22
Ranking of 2023 business applications per capita
-
3,771
2023 projected business formations within 4 quarters
-
6.5%
Percent of applications projected to become an employer business
Oregon
-
12.8%
The percentage change of new business applications filed in December 2023 compared to December 2022
-
56,662
New business applications in 2023
-
#32
Ranking of 2023 business applications per capita
-
4,778
2023 projected business formations within 4 quarters
-
8.4%
Percent of applications projected to become an employer business
Pennsylvania
-
13.8%
The percentage change of new business applications filed in December 2023 compared to December 2022
-
153,599
New business applications in 2023
-
#41
Ranking of 2023 business applications per capita
-
9,817
2023 projected business formations within 4 quarters
-
6.4%
Percent of applications projected to become an employer business
Rhode Island
-
3.4%
The percentage change of new business applications filed in December 2023 compared to December 2022
-
11,639
New business applications in 2023
-
#49
Ranking of 2023 business applications per capita
-
1,155
2023 projected business formations within 4 quarters
-
9.9%
Percent of applications projected to become an employer business
South Carolina
-
-2.2%
The percentage change of new business applications filed in December 2023 compared to December 2022
-
92,138
New business applications in 2023
-
#13
Ranking of 2023 business applications per capita
-
5,384
2023 projected business formations within 4 quarters
-
5.8%
Percent of applications projected to become an employer business
South Dakota
-
20.6%
The percentage change of new business applications filed in December 2023 compared to December 2022
-
11,311
New business applications in 2023
-
#35
Ranking of 2023 business applications per capita
-
1,114
2023 projected business formations within 4 quarters
-
9.8%
Percent of applications projected to become an employer business
Tennessee
-
8.2%
The percentage change of new business applications filed in December 2023 compared to December 2022
-
96,903
New business applications in 2023
-
#30
Ranking of 2023 business applications per capita
-
6,446
2023 projected business formations within 4 quarters
-
6.7%
Percent of applications projected to become an employer business
Texas
-
4.4%
The percentage change of new business applications filed in December 2023 compared to December 2022
-
501,398
New business applications in 2023
-
#14
Ranking of 2023 business applications per capita
-
35,113
2023 projected business formations within 4 quarters
-
7.0%
Percent of applications projected to become an employer business
Utah
-
21.5%
The percentage change of new business applications filed in December 2023 compared to December 2022
-
71,877
New business applications in 2023
-
#6
Ranking of 2023 business applications per capita
-
5,608
2023 projected business formations within 4 quarters
-
7.8%
Percent of applications projected to become an employer business
Vermont
-
0.2%
The percentage change of new business applications filed in December 2023 compared to December 2022
-
7,516
New business applications in 2023
-
#45
Ranking of 2023 business applications per capita
-
645
2023 projected business formations within 4 quarters
-
8.6%
Percent of applications projected to become an employer business
Virginia
-
2.7%
The percentage change of new business applications filed in December 2023 compared to December 2022
-
132,075
New business applications in 2023
-
#21
Ranking of 2023 business applications per capita
-
7,781
2023 projected business formations within 4 quarters
-
5.9%
Percent of applications projected to become an employer business
Washington
-
6.8%
The percentage change of new business applications filed in December 2023 compared to December 2022
-
97,603
New business applications in 2023
-
#38
Ranking of 2023 business applications per capita
-
9,181
2023 projected business formations within 4 quarters
-
9.4%
Percent of applications projected to become an employer business
West Virginia
-
5.5%
The percentage change of new business applications filed in December 2023 compared to December 2022
-
15,297
New business applications in 2023
-
#51
Ranking of 2023 business applications per capita
-
1,025
2023 projected business formations within 4 quarters
-
6.7%
Percent of applications projected to become an employer business
Wisconsin
-
-1.7%
The percentage change of new business applications filed in December 2023 compared to December 2022
-
65,409
New business applications in 2023
-
#46
Ranking of 2023 business applications per capita
-
4,318
2023 projected business formations within 4 quarters
-
6.6%
Percent of applications projected to become an employer business
Wyoming
-
29.5%
The percentage change of new business applications filed in December 2023 compared to December 2022
-
58,807
New business applications in 2023
-
#1
Ranking of 2023 business applications per capita
-
2,330
2023 projected business formations within 4 quarters
-
4.0%
Percent of applications projected to become an employer business
The Census Bureau’s projected business formations are based on a forward-looking econometric model. This model estimates the likelihood a business application turns into a full-fledged business utilizing data and trends from the preceding four quarters and eight quarters from the month of application. A complete list of the Bureau’s business formation statistics definitions can be viewed here.
The data for states that have significantly higher incorporation rates compared to their population may not accurately reflect projected business formations in those states.
Download the national, state, and county business formation data here.
Applications are open now for the CO—100, a premier awards program honoring top small businesses across the country. Honorees will receive exclusive opportunities, brand exposure, and networking.
Why There Are So Many New Businesses
Entrepreneurs solve problems, and when America experienced huge problems in a concentrated time frame during the COVID-19 pandemic, entrepreneurs rose to the occasion. New economic needs and changing consumer preferences created more circumstances for new businesses to start.
Many individuals laid off as a result of pandemic shutdowns turned their ideas and hobbies into a business that could be run from home. The number of non-store retailers skyrocketed as individuals sold goods from home.
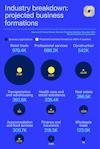
Professional and business services also experienced an uptick as entrepreneurs tapped into the need for consulting services. This trend held true in 2023, with most business applications being filed for enterprises in the retail trade and professional services industries.
America’s unique free enterprise system allows for this kind of entrepreneurial growth. And the data clearly shows Americans are hungry to start their own small businesses.

Starting a business is a cornerstone of the American Dream and allows individuals to solve problems, strengthen society, and earn an income. Additionally, higher costs have prompted individuals to earn additional money through the creation of multiple business entities.
Padded savings and more availability of credit card debt from the pandemic shutdown can serve as a nest egg while an entrepreneur is working to get their business off the ground. Greater access to technology in recent years has also allowed smaller operations across the nation—and the globe—to grow and level the playing field with large firms.

In addition to the record-high number of applications being filed, the projected number of new business formations that could emerge from those applications is increasing, too. On average, 9.5% of business applications lead to business formations from 2016 to 2019.
Between 2020 and 2023, there were 20.4 million business applications filed, so if past formations as a share of applications are comparable today, we’d expect 1.9 million businesses, or 9.5% of applications, to result in businesses employing workers.
Congress and the Administration should be doing everything possible to ensure these new businesses grow and succeed. The U.S. Chamber of Commerce details how elected officials can foster new entrepreneurs’ freedom to exist and thrive in the Small Business Bill of Rights.
Government must support policy that supports the creation of new business, not hinder it, as new businesses bring more opportunity to our communities. As new businesses grow, they are likely to employ more people in the community and fuel the local economy.
Find the latest from the U.S. Chamber’s small business advocacy and resources.
About the authors
Stephanie Ferguson Melhorn
Stephanie Ferguson Melhorn is the Executive Director, Workforce and International Labor Policy. Her work on the labor shortage has been cited in the Wall Street Journal, Washington Post, and Associated Press.

Lindsay Burton
Lindsay (Cates) Burton is a director on the communications team. She leads strategic communications for member marketing partnerships and small business advocacy programs. She previously worked as a writer and editor at U.S. News and World Report.