
Former Senior Economist, Regulatory Analysis, U.S. Chamber of Commerce
Published
September 12, 2019
Welcome to the U.S. Chamber of Commerce’s new Monthly Workforce Monitor — an analysis of the state of the U.S. job market and worker availability.
Analysis of newly available government data show that there was barely one available worker for every job opening in America in July, offering further evidence of historically tight labor market conditions over the past year and a significant “people gap” challenge with regard to the American workforce.
The Worker Availability Ratio — a new analysis developed by the U.S. Chamber of Commerce to measure the number of available workers for every job opening — ticked down to 1.08 in July, meaning there were 1.08 available workers for every job vacancy. That’s nearly unchanged from a 1.09 reading in June, and the 12-month moving average (which smooths seasonal and sampling variations) remained at the historically low level of 1.04 available workers per job opening for the fourth consecutive month.
For our calculations, the number of available workers in July 2019 included 6.6 million “actively job seeking” unemployed persons and 1.5 million others whom the U.S. Bureau of Labor Statistics classifies as not in the labor force but “marginally attached;” that is, they want jobs, they are available for work, and they have looked for work in the past year, though they have not actively looked for work in the most recent month.
The analysis reveals a labor market that is remarkably tighter than just a decade ago, when there were approximately 8 workers available for each open job. Over the almost 20-year history of available data, there have been an average of 2.9 workers for each open position. Said another way, employers looking to fill open positions are experiencing a labor market that’s nearly three times tighter than it has been on average over the last two decades and eight times tighter than it was 10 years ago.
In our dynamic labor market, workers are continually shifting between jobs or moving in and out of the market. Over on the employer side, jobs are continually being filled as new ones open up. Consequently, the individuals available for work and the jobs open are not the same from one month to the next, but the trend toward fewer available workers relative to the rising number of job openings shows, in broad terms, the increasing tightness of the labor market.
Of course, available workers vary in terms of experience, skills, and location, so they may not match the occupational, skill, location, and other needs associated with job openings. This “mismatch” problem becomes especially critical when the Worker Availability Ratio is relatively low, as it is currently.
The data draw attention to an important but overshadowed “gap” in the American workforce. While much attention has been given to the skills gap – that is, that too many people lack the skills they need to compete for jobs in today’s economy — our nation also faces a growing people gap — in other words, there simply are too few workers relative to the demand. To learn more about how the U.S. Chamber and the U.S. Chamber of Commerce Foundation are working to close the gaps in the American workforce, visit ourCenter for Education and Workforce.
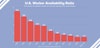
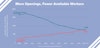
The above charts show annualized monthly averages for each year
Methodology
To calculate the Worker Availability Ratio, we first establish the total number of available workers by adding the total “unemployed” individuals (those who actively sought work that month) and the total “marginally attached” individuals (those who did not seek work that month but say they want and are available for work and have sought work in the past year), as reported monthly by the Bureau of Labor Statistics. We then divide the total “available workers” by the number of job openings, as reported in BLS’s monthly Job Openings and Labor Turnover Survey (JOLTS).
The data used in these calculations is all “not seasonally adjusted” because BLS does not publish seasonally adjusted estimates for the “marginally attached” series.
About the author
Ronald Bird
Bird is a former senior economist specializing in regulatory economics at the Chamber. His work includes analyzing and evaluating estimates of regulations’ costs and benefits produced by the government to identify significant errors and omissions.


