Stephanie Ferguson Melhorn
Executive Director, Workforce & International Labor Policy, U.S. Chamber of Commerce
Published
September 15, 2023
The state of Georgia has a favorable landscape for businesses and individuals, with a diverse economy, strong labor market recovery, and a robust small business ecosystem. Immigrants contribute meaningfully to the state's workforce and economy, while educational attainment, quality of life, and cost of living factors remain promising.
The Worker Shortage Across America
Explore the interactive map below to see the impact of the worker shortage crisis in each state.
Alabama
-
0.73
Alabama's Worker Shortage Index
- Job Openings: 108,000
- Unemployed Workers: 78,740
- Labor Force Participation Rate: 57.9%
- Unemployment Rate: 3.3%
- Quit Rate: 2.2%
- Hiring Rate: 3.6%
Alaska
-
0.85
Alaska's Worker Shortage Index
- Job Openings: 20,000
- Unemployed Workers: 17,067
- Labor Force Participation Rate: 65.2%
- Unemployment Rate: 4.7%
- Quit Rate: 2.7%
- Hiring Rate: 5.3%
Arizona
-
0.90
Arizona's Worker Shortage Index
- Job Openings: 170,000
- Unemployed Workers: 153,827
- Labor Force Participation Rate: 61.5%
- Unemployment Rate: 4.1%
- Quit Rate: 2.0%
- Hiring Rate: 3.6%
Arkansas
-
0.69
Arkansas's Worker Shortage Index
- Job Openings: 76,000
- Unemployed Workers: 52,230
- Labor Force Participation Rate: 58.4%
- Unemployment Rate: 3.7%
- Quit Rate: 2.3%
- Hiring Rate: 3.8%
California
-
1.60
California's Worker Shortage Index
- Job Openings: 659,000
- Unemployed Workers: 1,054,992
- Labor Force Participation Rate: 62.2%
- Unemployment Rate: 5.3%
- Quit Rate: 2.0%
- Hiring Rate: 2.8%
Colorado
-
1.09
Colorado's Worker Shortage Index
- Job Openings: 145,000
- Unemployed Workers: 158,688
- Labor Force Participation Rate: 67.8%
- Unemployment Rate: 4.8%
- Quit Rate: 2.1%
- Hiring Rate: 4.5%
Connecticut
-
0.99
Connecticut's Worker Shortage Index
- Job Openings: 73,000
- Unemployed Workers: 72,232
- Labor Force Participation Rate: 65.0%
- Unemployment Rate: 3.7%
- Quit Rate: 2.1%
- Hiring Rate: 3.1%
Delaware
-
0.89
Delaware's Worker Shortage Index
- Job Openings: 22,000
- Unemployed Workers: 19,598
- Labor Force Participation Rate: 58.9%
- Unemployment Rate: 3.9%
- Quit Rate: 2.2%
- Hiring Rate: 3.6%
District of Columbia
-
0.90
District of Columbia's Worker Shortage Index
- Job Openings: 27,000
- Unemployed Workers: 24,409
- Labor Force Participation Rate: 72.4%
- Unemployment Rate: 5.8%
- Quit Rate: 1.8%
- Hiring Rate: 2.3%
Florida
-
0.95
Florida's Worker Shortage Index
- Job Openings: 433,000
- Unemployed Workers: 410,460
- Labor Force Participation Rate: 58.0%
- Unemployment Rate: 3.7%
- Quit Rate: 2.4%
- Hiring Rate: 3.5%
Georgia
-
0.72
Georgia's Worker Shortage Index
- Job Openings: 266,000
- Unemployed Workers: 191,739
- Labor Force Participation Rate: 60.8%
- Unemployment Rate: 3.6%
- Quit Rate: 2.2%
- Hiring Rate: 3.7%
Hawaii
-
0.79
Hawaii's Worker Shortage Index
- Job Openings: 25,000
- Unemployed Workers: 19,655
- Labor Force Participation Rate: 60.5%
- Unemployment Rate: 2.9%
- Quit Rate: 1.8%
- Hiring Rate: 3.2%
Idaho
-
0.87
Idaho's Worker Shortage Index
- Job Openings: 43,000
- Unemployed Workers: 37,300
- Labor Force Participation Rate: 63.6%
- Unemployment Rate: 3.7%
- Quit Rate: 2.6%
- Hiring Rate: 4.4%
Illinois
-
1.11
Illinois's Worker Shortage Index
- Job Openings: 291,000
- Unemployed Workers: 321,693
- Labor Force Participation Rate: 64.9%
- Unemployment Rate: 4.8%
- Quit Rate: 2.4%
- Hiring Rate: 3.2%
Indiana
-
0.88
Indiana's Worker Shortage Index
- Job Openings: 153,000
- Unemployed Workers: 134,329
- Labor Force Participation Rate: 63.7%
- Unemployment Rate: 3.9%
- Quit Rate: 2.9%
- Hiring Rate: 4.6%
Iowa
-
0.90
Iowa's Worker Shortage Index
- Job Openings: 67,000
- Unemployed Workers: 60,570
- Labor Force Participation Rate: 67.2%
- Unemployment Rate: 3.5%
- Quit Rate: 2.6%
- Hiring Rate: 3.5%
Kansas
-
0.82
Kansas's Worker Shortage Index
- Job Openings: 73,000
- Unemployed Workers: 59,664
- Labor Force Participation Rate: 67.1%
- Unemployment Rate: 3.8%
- Quit Rate: 2.4%
- Hiring Rate: 3.4%
Kentucky
-
1.08
Kentucky's Worker Shortage Index
- Job Openings: 101,000
- Unemployed Workers: 109,315
- Labor Force Participation Rate: 58.4%
- Unemployment Rate: 5.2%
- Quit Rate: 2.0%
- Hiring Rate: 3.6%
Louisiana
-
0.93
Louisiana's Worker Shortage Index
- Job Openings: 98,000
- Unemployed Workers: 91,053
- Labor Force Participation Rate: 57.9%
- Unemployment Rate: 4.4%
- Quit Rate: 2.3%
- Hiring Rate: 3.9%
Maine
-
0.88
Maine's Worker Shortage Index
- Job Openings: 28,000
- Unemployed Workers: 24,509
- Labor Force Participation Rate: 60.1%
- Unemployment Rate: 3.5%
- Quit Rate: 2.3%
- Hiring Rate: 3.6%
Maryland
-
0.76
Maryland's Worker Shortage Index
- Job Openings: 133,000
- Unemployed Workers: 100,476
- Labor Force Participation Rate: 64.8%
- Unemployment Rate: 3.1%
- Quit Rate: 2.1%
- Hiring Rate: 3.2%
Massachusetts
-
1.22
Massachusetts's Worker Shortage Index
- Job Openings: 148,000
- Unemployed Workers: 180,846
- Labor Force Participation Rate: 66.7%
- Unemployment Rate: 4.6%
- Quit Rate: 1.8%
- Hiring Rate: 3.2%
Michigan
-
1.24
Michigan's Worker Shortage Index
- Job Openings: 225,000
- Unemployed Workers: 277,879
- Labor Force Participation Rate: 62.0%
- Unemployment Rate: 5.5%
- Quit Rate: 2.1%
- Hiring Rate: 4.5%
Minnesota
-
0.53
Minnesota's Worker Shortage Index
- Job Openings: 187,000
- Unemployed Workers: 100,039
- Labor Force Participation Rate: 68.2%
- Unemployment Rate: 3.2%
- Quit Rate: 2.1%
- Hiring Rate: 3.5%
Mississippi
-
0.85
Mississippi's Worker Shortage Index
- Job Openings: 61,000
- Unemployed Workers: 52,084
- Labor Force Participation Rate: 56.2%
- Unemployment Rate: 4.0%
- Quit Rate: 2.1%
- Hiring Rate: 3.5%
Missouri
-
0.86
Missouri's Worker Shortage Index
- Job Openings: 145,000
- Unemployed Workers: 124,132
- Labor Force Participation Rate: 63.4%
- Unemployment Rate: 3.9%
- Quit Rate: 2.1%
- Hiring Rate: 3.1%
Montana
-
0.54
Montana's Worker Shortage Index
- Job Openings: 29,000
- Unemployed Workers: 15,697
- Labor Force Participation Rate: 62.3%
- Unemployment Rate: 2.7%
- Quit Rate: 3.0%
- Hiring Rate: 4.9%
Nebraska
-
0.66
Nebraska's Worker Shortage Index
- Job Openings: 49,000
- Unemployed Workers: 32,249
- Labor Force Participation Rate: 69.3%
- Unemployment Rate: 3.0%
- Quit Rate: 2.1%
- Hiring Rate: 3.6%
Nevada
-
1.38
Nevada's Worker Shortage Index
- Job Openings: 68,000
- Unemployed Workers: 93,534
- Labor Force Participation Rate: 62.9%
- Unemployment Rate: 5.6%
- Quit Rate: 2.1%
- Hiring Rate: 3.8%
New Hampshire
-
0.83
New Hampshire's Worker Shortage Index
- Job Openings: 29,000
- Unemployed Workers: 24,170
- Labor Force Participation Rate: 65.7%
- Unemployment Rate: 3.1%
- Quit Rate: 2.0%
- Hiring Rate: 3.4%
New Jersey
-
1.10
New Jersey's Worker Shortage Index
- Job Openings: 213,000
- Unemployed Workers: 234,394
- Labor Force Participation Rate: 63.9%
- Unemployment Rate: 4.8%
- Quit Rate: 1.7%
- Hiring Rate: 3.5%
New Mexico
-
0.96
New Mexico's Worker Shortage Index
- Job Openings: 44,000
- Unemployed Workers: 42,131
- Labor Force Participation Rate: 57.8%
- Unemployment Rate: 4.3%
- Quit Rate: 2.1%
- Hiring Rate: 3.4%
New York
-
0.95
New York's Worker Shortage Index
- Job Openings: 430,000
- Unemployed Workers: 410,366
- Labor Force Participation Rate: 61.0%
- Unemployment Rate: 4.2%
- Quit Rate: 1.5%
- Hiring Rate: 2.8%
North Carolina
-
0.77
North Carolina's Worker Shortage Index
- Job Openings: 255,000
- Unemployed Workers: 196,360
- Labor Force Participation Rate: 59.6%
- Unemployment Rate: 3.7%
- Quit Rate: 2.0%
- Hiring Rate: 3.0%
North Dakota
-
0.46
North Dakota's Worker Shortage Index
- Job Openings: 24,000
- Unemployed Workers: 11,009
- Labor Force Participation Rate: 69.5%
- Unemployment Rate: 2.6%
- Quit Rate: 2.4%
- Hiring Rate: 3.8%
Ohio
-
0.98
Ohio's Worker Shortage Index
- Job Openings: 296,000
- Unemployed Workers: 291,306
- Labor Force Participation Rate: 62.7%
- Unemployment Rate: 4.9%
- Quit Rate: 2.2%
- Hiring Rate: 3.4%
Oklahoma
-
0.69
Oklahoma's Worker Shortage Index
- Job Openings: 93,000
- Unemployed Workers: 64,249
- Labor Force Participation Rate: 62.6%
- Unemployment Rate: 3.2%
- Quit Rate: 2.3%
- Hiring Rate: 3.6%
Oregon
-
1.12
Oregon's Worker Shortage Index
- Job Openings: 92,000
- Unemployed Workers: 103,325
- Labor Force Participation Rate: 62.7%
- Unemployment Rate: 4.7%
- Quit Rate: 2.1%
- Hiring Rate: 3.3%
Pennsylvania
-
0.96
Pennsylvania's Worker Shortage Index
- Job Openings: 265,000
- Unemployed Workers: 255,589
- Labor Force Participation Rate: 61.6%
- Unemployment Rate: 3.9%
- Quit Rate: 1.5%
- Hiring Rate: 2.7%
Rhode Island
-
1.31
Rhode Island's Worker Shortage Index
- Job Openings: 22,000
- Unemployed Workers: 28,829
- Labor Force Participation Rate: 63.8%
- Unemployment Rate: 4.9%
- Quit Rate: 2.1%
- Hiring Rate: 3.5%
South Carolina
-
0.91
South Carolina's Worker Shortage Index
- Job Openings: 117,000
- Unemployed Workers: 106,498
- Labor Force Participation Rate: 57.5%
- Unemployment Rate: 4.2%
- Quit Rate: 2.3%
- Hiring Rate: 4.0%
South Dakota
-
0.41
South Dakota's Worker Shortage Index
- Job Openings: 22,000
- Unemployed Workers: 9,049
- Labor Force Participation Rate: 68.9%
- Unemployment Rate: 1.8%
- Quit Rate: 2.8%
- Hiring Rate: 3.8%
Tennessee
-
0.73
Tennessee's Worker Shortage Index
- Job Openings: 167,000
- Unemployed Workers: 122,290
- Labor Force Participation Rate: 59.7%
- Unemployment Rate: 3.5%
- Quit Rate: 2.3%
- Hiring Rate: 3.7%
Texas
-
1.15
Texas's Worker Shortage Index
- Job Openings: 558,000
- Unemployed Workers: 642,922
- Labor Force Participation Rate: 64.9%
- Unemployment Rate: 4.1%
- Quit Rate: 2.3%
- Hiring Rate: 3.7%
Utah
-
0.76
Utah's Worker Shortage Index
- Job Openings: 76,000
- Unemployed Workers: 57,518
- Labor Force Participation Rate: 68.3%
- Unemployment Rate: 3.1%
- Quit Rate: 2.2%
- Hiring Rate: 3.8%
Vermont
-
0.73
Vermont's Worker Shortage Index
- Job Openings: 13,000
- Unemployed Workers: 9,426
- Labor Force Participation Rate: 65.1%
- Unemployment Rate: 2.7%
- Quit Rate: 2.2%
- Hiring Rate: 3.8%
Virginia
-
0.69
Virginia's Worker Shortage Index
- Job Openings: 221,000
- Unemployed Workers: 151,942
- Labor Force Participation Rate: 65.4%
- Unemployment Rate: 3.3%
- Quit Rate: 2.1%
- Hiring Rate: 3.3%
Washington
-
1.28
Washington's Worker Shortage Index
- Job Openings: 140,000
- Unemployed Workers: 179,187
- Labor Force Participation Rate: 62.7%
- Unemployment Rate: 4.4%
- Quit Rate: 1.5%
- Hiring Rate: 3.0%
West Virginia
-
0.84
West Virginia's Worker Shortage Index
- Job Openings: 35,000
- Unemployed Workers: 29,441
- Labor Force Participation Rate: 54.3%
- Unemployment Rate: 3.8%
- Quit Rate: 2.5%
- Hiring Rate: 3.5%
Wisconsin
-
0.71
Wisconsin's Worker Shortage Index
- Job Openings: 146,000
- Unemployed Workers: 103,411
- Labor Force Participation Rate: 65.5%
- Unemployment Rate: 3.3%
- Quit Rate: 2.1%
- Hiring Rate: 3.5%
Wyoming
-
0.69
Wyoming's Worker Shortage Index
- Job Openings: 14,000
- Unemployed Workers: 9,714
- Labor Force Participation Rate: 62.5%
- Unemployment Rate: 3.3%
- Quit Rate: 2.7%
- Hiring Rate: 4.7%
The Chamber’s Worker Shortage Index ratio indicates the number of available workers for every job opening. A ratio above 1.0 indicates a surplus of available workers compared to job openings.
Georgia’s Labor Market
Prior to the pandemic, Georgia’s labor market was somewhat healthy. The state’s unemployment rate closely mirrored the national figure at 3.5%, but its labor force participation rate was a point lower than the national rate of 63.4%. There were 79 available workers for every 100 open jobs.
As of August 2023, Georgia’s current labor market has mostly recovered and it is displaying signs of improvement. However, the state's labor force participation rate continues to lag behind its pre-pandemic levels, just slightly over one percentage point below the national average.
Georgia’s unemployment rate remains lower than it was before the pandemic. Employers have a surplus of 130,000 job openings compared to February 2020. On the downside, Georgia is grappling with a workforce shortage, evident by the fact that there are only 54 available workers for every 100 open job positions in the state.
Georgia’s Business Environment
Georgia's business environment is diverse, encompassing a rich agricultural economy, numerous professional sports teams, several prominent universities, and serving as the headquarters for a number of favored Fortune 500 companies.
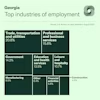
Most Georgians are employed by the trade, transportation, and utilities industries, as well as government with construction employment being relatively minimal. Georgia's employment landscape is shaped by its strong transportation infrastructure, encompassing extensive rail and highway networks, the world's busiest airport, and a major port.
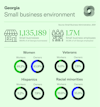
Georgia boasts a thriving small business ecosystem, with 99.6% of all Georgia businesses falling into this category. Forty-two percent of Georgia's workforce works within small businesses. Within this dynamic landscape, women own 45.8% of small businesses, 35.9% are minority-owned, 7.8% are owned by Hispanics, and 7.8% are veteran-owned.
Georgia’s Educational Attainment
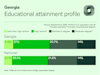
Georgia’s education levels are relatively on par with the national averages across the board. Nearly 90% have obtained at least a high school diploma or its equivalent. 35% of the population has attained a bachelor's degree, while 14% have secured a graduate degree.
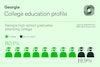
Fortunately for employers in the state, the vast majority (80%) of Georgia college freshmen are remaining in the state for their higher education, where the average in-state tuition is $7,457.
Out-of-state tuition in the Peach state is $23,167, significantly less expensive than the national average out-of-state tuition of $28,000. In total, roughly 543,000 students are enrolled in a Georgia college for the 2022-2023 school year. These students supply a rich talent pool from which local employers can recruit talent.
Quality of Life
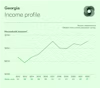
Georgia's median household income of $67,730 is lower than the national average of around $70,000, which places the state at the 37th rank among all states. Georgia’s tax rate between 2% and 5.75% positions the state among the lower tiers of other state tax rates.
Nearly a third (30%) of Georgia’s workforce work remote workers at least one day a week. For those commuting into an office, the average commute time is 28.7 minutes. The Council for Community and Economic Research measures states’ costs of living compared to the national average of 100. Georgia’s cost of living index falls at 91, meaning the state is more affordable in comparison to the national cost of living. The median rent settles at $1,042, while the median home cost is $ $320,437, both falling beneath the national average. Nearly 65% of the population owned their housing unit in 2021. The state experienced a growth rate of 1.71% from 2020 to 2022.
Immigration
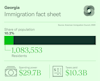
In the U.S., immigrants tend to be of working age in comparison to native-born individuals. As workers, these immigrants are also contributing to support programs like Medicare and Social Security.
Looking at Georgia in particular, immigrants comprise 10.2% of the state's population, totaling over one million individuals. Their collective spending power amounts to $29.7 billion, while their tax contributions reach $10.3 billion.
Explore More States


About the authors

Makinizi Hoover
Makinizi Hoover is Housing Policy Lead at the U.S. Chamber of Commerce, where she leads the Chamber’s work to advance supply-side reforms that improve housing affordability and availability.
Stephanie Ferguson Melhorn
Stephanie Ferguson Melhorn is the Executive Director, Workforce and International Labor Policy. Her work on the labor shortage has been cited in the Wall Street Journal, Washington Post, and Associated Press.

Isabella Lucy
Isabella has created stunning visualizations tackling pressing issues like the worker shortage, the benefits of hiring veterans, the lifespan of small businesses, and the future of work.