Stephanie Ferguson Melhorn
Executive Director, Workforce & International Labor Policy, U.S. Chamber of Commerce
Published
October 13, 2023
The state of Tennessee has a favorable landscape for businesses and individuals, with a diverse economy, a mild labor market recovery, and a robust small business ecosystem. Immigrants contribute meaningfully to the state's workforce and economy, while educational attainment, quality of life, and cost of living factors remain promising.
The Worker Shortage Across America
Explore the interactive map below to see the impact of the worker shortage crisis in each state.
Alabama
-
0.73
Alabama's Worker Shortage Index
- Job Openings: 108,000
- Unemployed Workers: 78,740
- Labor Force Participation Rate: 57.9%
- Unemployment Rate: 3.3%
- Quit Rate: 2.2%
- Hiring Rate: 3.6%
Alaska
-
0.85
Alaska's Worker Shortage Index
- Job Openings: 20,000
- Unemployed Workers: 17,067
- Labor Force Participation Rate: 65.2%
- Unemployment Rate: 4.7%
- Quit Rate: 2.7%
- Hiring Rate: 5.3%
Arizona
-
0.90
Arizona's Worker Shortage Index
- Job Openings: 170,000
- Unemployed Workers: 153,827
- Labor Force Participation Rate: 61.5%
- Unemployment Rate: 4.1%
- Quit Rate: 2.0%
- Hiring Rate: 3.6%
Arkansas
-
0.69
Arkansas's Worker Shortage Index
- Job Openings: 76,000
- Unemployed Workers: 52,230
- Labor Force Participation Rate: 58.4%
- Unemployment Rate: 3.7%
- Quit Rate: 2.3%
- Hiring Rate: 3.8%
California
-
1.60
California's Worker Shortage Index
- Job Openings: 659,000
- Unemployed Workers: 1,054,992
- Labor Force Participation Rate: 62.2%
- Unemployment Rate: 5.3%
- Quit Rate: 2.0%
- Hiring Rate: 2.8%
Colorado
-
1.09
Colorado's Worker Shortage Index
- Job Openings: 145,000
- Unemployed Workers: 158,688
- Labor Force Participation Rate: 67.8%
- Unemployment Rate: 4.8%
- Quit Rate: 2.1%
- Hiring Rate: 4.5%
Connecticut
-
0.99
Connecticut's Worker Shortage Index
- Job Openings: 73,000
- Unemployed Workers: 72,232
- Labor Force Participation Rate: 65.0%
- Unemployment Rate: 3.7%
- Quit Rate: 2.1%
- Hiring Rate: 3.1%
Delaware
-
0.89
Delaware's Worker Shortage Index
- Job Openings: 22,000
- Unemployed Workers: 19,598
- Labor Force Participation Rate: 58.9%
- Unemployment Rate: 3.9%
- Quit Rate: 2.2%
- Hiring Rate: 3.6%
District of Columbia
-
0.90
District of Columbia's Worker Shortage Index
- Job Openings: 27,000
- Unemployed Workers: 24,409
- Labor Force Participation Rate: 72.4%
- Unemployment Rate: 5.8%
- Quit Rate: 1.8%
- Hiring Rate: 2.3%
Florida
-
0.95
Florida's Worker Shortage Index
- Job Openings: 433,000
- Unemployed Workers: 410,460
- Labor Force Participation Rate: 58.0%
- Unemployment Rate: 3.7%
- Quit Rate: 2.4%
- Hiring Rate: 3.5%
Georgia
-
0.72
Georgia's Worker Shortage Index
- Job Openings: 266,000
- Unemployed Workers: 191,739
- Labor Force Participation Rate: 60.8%
- Unemployment Rate: 3.6%
- Quit Rate: 2.2%
- Hiring Rate: 3.7%
Hawaii
-
0.79
Hawaii's Worker Shortage Index
- Job Openings: 25,000
- Unemployed Workers: 19,655
- Labor Force Participation Rate: 60.5%
- Unemployment Rate: 2.9%
- Quit Rate: 1.8%
- Hiring Rate: 3.2%
Idaho
-
0.87
Idaho's Worker Shortage Index
- Job Openings: 43,000
- Unemployed Workers: 37,300
- Labor Force Participation Rate: 63.6%
- Unemployment Rate: 3.7%
- Quit Rate: 2.6%
- Hiring Rate: 4.4%
Illinois
-
1.11
Illinois's Worker Shortage Index
- Job Openings: 291,000
- Unemployed Workers: 321,693
- Labor Force Participation Rate: 64.9%
- Unemployment Rate: 4.8%
- Quit Rate: 2.4%
- Hiring Rate: 3.2%
Indiana
-
0.88
Indiana's Worker Shortage Index
- Job Openings: 153,000
- Unemployed Workers: 134,329
- Labor Force Participation Rate: 63.7%
- Unemployment Rate: 3.9%
- Quit Rate: 2.9%
- Hiring Rate: 4.6%
Iowa
-
0.90
Iowa's Worker Shortage Index
- Job Openings: 67,000
- Unemployed Workers: 60,570
- Labor Force Participation Rate: 67.2%
- Unemployment Rate: 3.5%
- Quit Rate: 2.6%
- Hiring Rate: 3.5%
Kansas
-
0.82
Kansas's Worker Shortage Index
- Job Openings: 73,000
- Unemployed Workers: 59,664
- Labor Force Participation Rate: 67.1%
- Unemployment Rate: 3.8%
- Quit Rate: 2.4%
- Hiring Rate: 3.4%
Kentucky
-
1.08
Kentucky's Worker Shortage Index
- Job Openings: 101,000
- Unemployed Workers: 109,315
- Labor Force Participation Rate: 58.4%
- Unemployment Rate: 5.2%
- Quit Rate: 2.0%
- Hiring Rate: 3.6%
Louisiana
-
0.93
Louisiana's Worker Shortage Index
- Job Openings: 98,000
- Unemployed Workers: 91,053
- Labor Force Participation Rate: 57.9%
- Unemployment Rate: 4.4%
- Quit Rate: 2.3%
- Hiring Rate: 3.9%
Maine
-
0.88
Maine's Worker Shortage Index
- Job Openings: 28,000
- Unemployed Workers: 24,509
- Labor Force Participation Rate: 60.1%
- Unemployment Rate: 3.5%
- Quit Rate: 2.3%
- Hiring Rate: 3.6%
Maryland
-
0.76
Maryland's Worker Shortage Index
- Job Openings: 133,000
- Unemployed Workers: 100,476
- Labor Force Participation Rate: 64.8%
- Unemployment Rate: 3.1%
- Quit Rate: 2.1%
- Hiring Rate: 3.2%
Massachusetts
-
1.22
Massachusetts's Worker Shortage Index
- Job Openings: 148,000
- Unemployed Workers: 180,846
- Labor Force Participation Rate: 66.7%
- Unemployment Rate: 4.6%
- Quit Rate: 1.8%
- Hiring Rate: 3.2%
Michigan
-
1.24
Michigan's Worker Shortage Index
- Job Openings: 225,000
- Unemployed Workers: 277,879
- Labor Force Participation Rate: 62.0%
- Unemployment Rate: 5.5%
- Quit Rate: 2.1%
- Hiring Rate: 4.5%
Minnesota
-
0.53
Minnesota's Worker Shortage Index
- Job Openings: 187,000
- Unemployed Workers: 100,039
- Labor Force Participation Rate: 68.2%
- Unemployment Rate: 3.2%
- Quit Rate: 2.1%
- Hiring Rate: 3.5%
Mississippi
-
0.85
Mississippi's Worker Shortage Index
- Job Openings: 61,000
- Unemployed Workers: 52,084
- Labor Force Participation Rate: 56.2%
- Unemployment Rate: 4.0%
- Quit Rate: 2.1%
- Hiring Rate: 3.5%
Missouri
-
0.86
Missouri's Worker Shortage Index
- Job Openings: 145,000
- Unemployed Workers: 124,132
- Labor Force Participation Rate: 63.4%
- Unemployment Rate: 3.9%
- Quit Rate: 2.1%
- Hiring Rate: 3.1%
Montana
-
0.54
Montana's Worker Shortage Index
- Job Openings: 29,000
- Unemployed Workers: 15,697
- Labor Force Participation Rate: 62.3%
- Unemployment Rate: 2.7%
- Quit Rate: 3.0%
- Hiring Rate: 4.9%
Nebraska
-
0.66
Nebraska's Worker Shortage Index
- Job Openings: 49,000
- Unemployed Workers: 32,249
- Labor Force Participation Rate: 69.3%
- Unemployment Rate: 3.0%
- Quit Rate: 2.1%
- Hiring Rate: 3.6%
Nevada
-
1.38
Nevada's Worker Shortage Index
- Job Openings: 68,000
- Unemployed Workers: 93,534
- Labor Force Participation Rate: 62.9%
- Unemployment Rate: 5.6%
- Quit Rate: 2.1%
- Hiring Rate: 3.8%
New Hampshire
-
0.83
New Hampshire's Worker Shortage Index
- Job Openings: 29,000
- Unemployed Workers: 24,170
- Labor Force Participation Rate: 65.7%
- Unemployment Rate: 3.1%
- Quit Rate: 2.0%
- Hiring Rate: 3.4%
New Jersey
-
1.10
New Jersey's Worker Shortage Index
- Job Openings: 213,000
- Unemployed Workers: 234,394
- Labor Force Participation Rate: 63.9%
- Unemployment Rate: 4.8%
- Quit Rate: 1.7%
- Hiring Rate: 3.5%
New Mexico
-
0.96
New Mexico's Worker Shortage Index
- Job Openings: 44,000
- Unemployed Workers: 42,131
- Labor Force Participation Rate: 57.8%
- Unemployment Rate: 4.3%
- Quit Rate: 2.1%
- Hiring Rate: 3.4%
New York
-
0.95
New York's Worker Shortage Index
- Job Openings: 430,000
- Unemployed Workers: 410,366
- Labor Force Participation Rate: 61.0%
- Unemployment Rate: 4.2%
- Quit Rate: 1.5%
- Hiring Rate: 2.8%
North Carolina
-
0.77
North Carolina's Worker Shortage Index
- Job Openings: 255,000
- Unemployed Workers: 196,360
- Labor Force Participation Rate: 59.6%
- Unemployment Rate: 3.7%
- Quit Rate: 2.0%
- Hiring Rate: 3.0%
North Dakota
-
0.46
North Dakota's Worker Shortage Index
- Job Openings: 24,000
- Unemployed Workers: 11,009
- Labor Force Participation Rate: 69.5%
- Unemployment Rate: 2.6%
- Quit Rate: 2.4%
- Hiring Rate: 3.8%
Ohio
-
0.98
Ohio's Worker Shortage Index
- Job Openings: 296,000
- Unemployed Workers: 291,306
- Labor Force Participation Rate: 62.7%
- Unemployment Rate: 4.9%
- Quit Rate: 2.2%
- Hiring Rate: 3.4%
Oklahoma
-
0.69
Oklahoma's Worker Shortage Index
- Job Openings: 93,000
- Unemployed Workers: 64,249
- Labor Force Participation Rate: 62.6%
- Unemployment Rate: 3.2%
- Quit Rate: 2.3%
- Hiring Rate: 3.6%
Oregon
-
1.12
Oregon's Worker Shortage Index
- Job Openings: 92,000
- Unemployed Workers: 103,325
- Labor Force Participation Rate: 62.7%
- Unemployment Rate: 4.7%
- Quit Rate: 2.1%
- Hiring Rate: 3.3%
Pennsylvania
-
0.96
Pennsylvania's Worker Shortage Index
- Job Openings: 265,000
- Unemployed Workers: 255,589
- Labor Force Participation Rate: 61.6%
- Unemployment Rate: 3.9%
- Quit Rate: 1.5%
- Hiring Rate: 2.7%
Rhode Island
-
1.31
Rhode Island's Worker Shortage Index
- Job Openings: 22,000
- Unemployed Workers: 28,829
- Labor Force Participation Rate: 63.8%
- Unemployment Rate: 4.9%
- Quit Rate: 2.1%
- Hiring Rate: 3.5%
South Carolina
-
0.91
South Carolina's Worker Shortage Index
- Job Openings: 117,000
- Unemployed Workers: 106,498
- Labor Force Participation Rate: 57.5%
- Unemployment Rate: 4.2%
- Quit Rate: 2.3%
- Hiring Rate: 4.0%
South Dakota
-
0.41
South Dakota's Worker Shortage Index
- Job Openings: 22,000
- Unemployed Workers: 9,049
- Labor Force Participation Rate: 68.9%
- Unemployment Rate: 1.8%
- Quit Rate: 2.8%
- Hiring Rate: 3.8%
Tennessee
-
0.73
Tennessee's Worker Shortage Index
- Job Openings: 167,000
- Unemployed Workers: 122,290
- Labor Force Participation Rate: 59.7%
- Unemployment Rate: 3.5%
- Quit Rate: 2.3%
- Hiring Rate: 3.7%
Texas
-
1.15
Texas's Worker Shortage Index
- Job Openings: 558,000
- Unemployed Workers: 642,922
- Labor Force Participation Rate: 64.9%
- Unemployment Rate: 4.1%
- Quit Rate: 2.3%
- Hiring Rate: 3.7%
Utah
-
0.76
Utah's Worker Shortage Index
- Job Openings: 76,000
- Unemployed Workers: 57,518
- Labor Force Participation Rate: 68.3%
- Unemployment Rate: 3.1%
- Quit Rate: 2.2%
- Hiring Rate: 3.8%
Vermont
-
0.73
Vermont's Worker Shortage Index
- Job Openings: 13,000
- Unemployed Workers: 9,426
- Labor Force Participation Rate: 65.1%
- Unemployment Rate: 2.7%
- Quit Rate: 2.2%
- Hiring Rate: 3.8%
Virginia
-
0.69
Virginia's Worker Shortage Index
- Job Openings: 221,000
- Unemployed Workers: 151,942
- Labor Force Participation Rate: 65.4%
- Unemployment Rate: 3.3%
- Quit Rate: 2.1%
- Hiring Rate: 3.3%
Washington
-
1.28
Washington's Worker Shortage Index
- Job Openings: 140,000
- Unemployed Workers: 179,187
- Labor Force Participation Rate: 62.7%
- Unemployment Rate: 4.4%
- Quit Rate: 1.5%
- Hiring Rate: 3.0%
West Virginia
-
0.84
West Virginia's Worker Shortage Index
- Job Openings: 35,000
- Unemployed Workers: 29,441
- Labor Force Participation Rate: 54.3%
- Unemployment Rate: 3.8%
- Quit Rate: 2.5%
- Hiring Rate: 3.5%
Wisconsin
-
0.71
Wisconsin's Worker Shortage Index
- Job Openings: 146,000
- Unemployed Workers: 103,411
- Labor Force Participation Rate: 65.5%
- Unemployment Rate: 3.3%
- Quit Rate: 2.1%
- Hiring Rate: 3.5%
Wyoming
-
0.69
Wyoming's Worker Shortage Index
- Job Openings: 14,000
- Unemployed Workers: 9,714
- Labor Force Participation Rate: 62.5%
- Unemployment Rate: 3.3%
- Quit Rate: 2.7%
- Hiring Rate: 4.7%
The Chamber’s Worker Shortage Index ratio indicates the number of available workers for every job opening. A ratio above 1.0 indicates a surplus of available workers compared to job openings.
Tennessee’s Labor Market
Prior to the pandemic, Tennessee’s labor market was relatively healthy. The state's unemployment rate closely mirrored the national average, standing at 3.5%, but the labor force participation rate of 61.3% was lower than the national average. There were 84 available workers for every 100 open jobs.
As of August 2023, Tennessee's labor market was showing some signs of improvement, but it continues to face challenges. The state's labor participation rate is roughly two points lower than it was before the pandemic, indicating a slow return to the workforce. Since May 2021, there has been a persistent shortage of workers to fill open job positions in the state, and as of August 2023, there were only 56 available workers for every 100 open job positions. These trends are concerning for employers who currently have a surplus of 52,000 job openings compared to February 2020.
On a positive note, Tennessee's unemployment rate is now lower than pre-pandemic levels, and lower than the national average.
Tennessee’s Business Environment
Tennessee's business environment is characterized by its dynamic retail and wholesale sectors and a thriving travel and leisure industry that attracts visitors from all over. The state also serves as a hub for some of the nation's foremost manufacturing companies, specializing in semiconductor electronics, electrical engineering, and technology hardware and equipment.
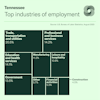
Among the industries monitored by the Bureau of Labor Statistics, the trade, transportation, and utilities sector, as well as the professional and business services sector, employ the highest number of Tennesseans, while the construction sector employs the fewest. These key industries in Tennessee are a testament to the state's robust exports of manufactured products and the flourishing retail and wholesale businesses. Additionally, Tennessee's strategic geographic location offers significant advantages, especially in the transportation sector, as it shares borders with more states than any other state in the U.S.
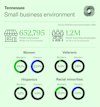
Tennessee's small business ecosystem is flourishing, with 99.5% of all businesses in the state falling into this category. Approximately 42.2% of Tennessee's workforce is employed by small businesses. Within this dynamic landscape, women own 42.9% of small businesses, 17% are minority-owned, 4% are owned by Hispanics, and 7.8% are veteran-owned, showcasing a diverse and inclusive entrepreneurial environment.
Tennessee’s Educational Attainment
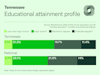
Ninety percent of Tennessee's population have their high school diploma or its equivalent. 31% of the population holds a bachelor's degree, and 11.4% have achieved a graduate degree, both slightly below the U.S. averages.
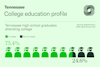
Fortunately for employers in the state, three-quarters of Tennessee college freshmen are remaining in the state for their higher education, where the average in-state tuition is $10,164.
Out-of-state tuition in the Volunteer state is $24,786, which is slightly lower than the national average out-of-state tuition of $28,000. Over 325,000 students are enrolled in a Tennessee college for the 2022-2023 school year, offering a rich talent pool for local employers to recruit from.
Quality of Life
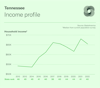
Tennessee's median household income of $65,380 is less than the national average of around $70,000, which places the state at the 40th rank among all states. Tennessee is among the few states that do not impose an income tax.
A quarter of Tennessee’s workforce work remote at least one day a week. For those commuting into an office, the average commute time is 25 minutes. Tennessee’s cost of living index, as measured by the Council for Community and Economic Research (with the national average set at 100), stands at 90.4. This means that the state is more affordable compared to the national cost of living. The median rent settles at $897, while the median home cost is $310,782, both falling beneath the national average. Nearly 67% of the population owned their housing unit in 2021, and the state experienced a growth rate of 1.8% from 2020 to 2022.
Immigration
In the U.S., immigrants tend to be of working age in comparison to native-born individuals. As workers, these immigrants are also contributing to support programs like Medicare and Social Security.
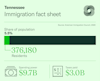
Looking at Tennessee in particular, immigrants comprise 5.5% of the state's population, totaling more than 376,000 individuals. Their collective spending power amounts to $9.7 billion, while their tax contributions reach three billion dollars.
Related


About the authors

Makinizi Hoover
Makinizi Hoover is Housing Policy Lead at the U.S. Chamber of Commerce, where she leads the Chamber’s work to advance supply-side reforms that improve housing affordability and availability.
Stephanie Ferguson Melhorn
Stephanie Ferguson Melhorn is the Executive Director, Workforce and International Labor Policy. Her work on the labor shortage has been cited in the Wall Street Journal, Washington Post, and Associated Press.

Isabella Lucy
Isabella has created stunning visualizations tackling pressing issues like the worker shortage, the benefits of hiring veterans, the lifespan of small businesses, and the future of work.