Stephanie Ferguson Melhorn
Executive Director, Workforce & International Labor Policy, U.S. Chamber of Commerce
Published
September 15, 2023
The state of Vermont has a favorable landscape for businesses and individuals, with a diverse economy and a robust small business ecosystem. Educational attainment, quality of life, and cost of living factors remain promising.
The Worker Shortage Across America
Explore the interactive map below to see the impact of the worker shortage crisis in each state.
Alabama
-
0.73
Alabama's Worker Shortage Index
- Job Openings: 108,000
- Unemployed Workers: 78,740
- Labor Force Participation Rate: 57.9%
- Unemployment Rate: 3.3%
- Quit Rate: 2.2%
- Hiring Rate: 3.6%
Alaska
-
0.85
Alaska's Worker Shortage Index
- Job Openings: 20,000
- Unemployed Workers: 17,067
- Labor Force Participation Rate: 65.2%
- Unemployment Rate: 4.7%
- Quit Rate: 2.7%
- Hiring Rate: 5.3%
Arizona
-
0.90
Arizona's Worker Shortage Index
- Job Openings: 170,000
- Unemployed Workers: 153,827
- Labor Force Participation Rate: 61.5%
- Unemployment Rate: 4.1%
- Quit Rate: 2.0%
- Hiring Rate: 3.6%
Arkansas
-
0.69
Arkansas's Worker Shortage Index
- Job Openings: 76,000
- Unemployed Workers: 52,230
- Labor Force Participation Rate: 58.4%
- Unemployment Rate: 3.7%
- Quit Rate: 2.3%
- Hiring Rate: 3.8%
California
-
1.60
California's Worker Shortage Index
- Job Openings: 659,000
- Unemployed Workers: 1,054,992
- Labor Force Participation Rate: 62.2%
- Unemployment Rate: 5.3%
- Quit Rate: 2.0%
- Hiring Rate: 2.8%
Colorado
-
1.09
Colorado's Worker Shortage Index
- Job Openings: 145,000
- Unemployed Workers: 158,688
- Labor Force Participation Rate: 67.8%
- Unemployment Rate: 4.8%
- Quit Rate: 2.1%
- Hiring Rate: 4.5%
Connecticut
-
0.99
Connecticut's Worker Shortage Index
- Job Openings: 73,000
- Unemployed Workers: 72,232
- Labor Force Participation Rate: 65.0%
- Unemployment Rate: 3.7%
- Quit Rate: 2.1%
- Hiring Rate: 3.1%
Delaware
-
0.89
Delaware's Worker Shortage Index
- Job Openings: 22,000
- Unemployed Workers: 19,598
- Labor Force Participation Rate: 58.9%
- Unemployment Rate: 3.9%
- Quit Rate: 2.2%
- Hiring Rate: 3.6%
District of Columbia
-
0.90
District of Columbia's Worker Shortage Index
- Job Openings: 27,000
- Unemployed Workers: 24,409
- Labor Force Participation Rate: 72.4%
- Unemployment Rate: 5.8%
- Quit Rate: 1.8%
- Hiring Rate: 2.3%
Florida
-
0.95
Florida's Worker Shortage Index
- Job Openings: 433,000
- Unemployed Workers: 410,460
- Labor Force Participation Rate: 58.0%
- Unemployment Rate: 3.7%
- Quit Rate: 2.4%
- Hiring Rate: 3.5%
Georgia
-
0.72
Georgia's Worker Shortage Index
- Job Openings: 266,000
- Unemployed Workers: 191,739
- Labor Force Participation Rate: 60.8%
- Unemployment Rate: 3.6%
- Quit Rate: 2.2%
- Hiring Rate: 3.7%
Hawaii
-
0.79
Hawaii's Worker Shortage Index
- Job Openings: 25,000
- Unemployed Workers: 19,655
- Labor Force Participation Rate: 60.5%
- Unemployment Rate: 2.9%
- Quit Rate: 1.8%
- Hiring Rate: 3.2%
Idaho
-
0.87
Idaho's Worker Shortage Index
- Job Openings: 43,000
- Unemployed Workers: 37,300
- Labor Force Participation Rate: 63.6%
- Unemployment Rate: 3.7%
- Quit Rate: 2.6%
- Hiring Rate: 4.4%
Illinois
-
1.11
Illinois's Worker Shortage Index
- Job Openings: 291,000
- Unemployed Workers: 321,693
- Labor Force Participation Rate: 64.9%
- Unemployment Rate: 4.8%
- Quit Rate: 2.4%
- Hiring Rate: 3.2%
Indiana
-
0.88
Indiana's Worker Shortage Index
- Job Openings: 153,000
- Unemployed Workers: 134,329
- Labor Force Participation Rate: 63.7%
- Unemployment Rate: 3.9%
- Quit Rate: 2.9%
- Hiring Rate: 4.6%
Iowa
-
0.90
Iowa's Worker Shortage Index
- Job Openings: 67,000
- Unemployed Workers: 60,570
- Labor Force Participation Rate: 67.2%
- Unemployment Rate: 3.5%
- Quit Rate: 2.6%
- Hiring Rate: 3.5%
Kansas
-
0.82
Kansas's Worker Shortage Index
- Job Openings: 73,000
- Unemployed Workers: 59,664
- Labor Force Participation Rate: 67.1%
- Unemployment Rate: 3.8%
- Quit Rate: 2.4%
- Hiring Rate: 3.4%
Kentucky
-
1.08
Kentucky's Worker Shortage Index
- Job Openings: 101,000
- Unemployed Workers: 109,315
- Labor Force Participation Rate: 58.4%
- Unemployment Rate: 5.2%
- Quit Rate: 2.0%
- Hiring Rate: 3.6%
Louisiana
-
0.93
Louisiana's Worker Shortage Index
- Job Openings: 98,000
- Unemployed Workers: 91,053
- Labor Force Participation Rate: 57.9%
- Unemployment Rate: 4.4%
- Quit Rate: 2.3%
- Hiring Rate: 3.9%
Maine
-
0.88
Maine's Worker Shortage Index
- Job Openings: 28,000
- Unemployed Workers: 24,509
- Labor Force Participation Rate: 60.1%
- Unemployment Rate: 3.5%
- Quit Rate: 2.3%
- Hiring Rate: 3.6%
Maryland
-
0.76
Maryland's Worker Shortage Index
- Job Openings: 133,000
- Unemployed Workers: 100,476
- Labor Force Participation Rate: 64.8%
- Unemployment Rate: 3.1%
- Quit Rate: 2.1%
- Hiring Rate: 3.2%
Massachusetts
-
1.22
Massachusetts's Worker Shortage Index
- Job Openings: 148,000
- Unemployed Workers: 180,846
- Labor Force Participation Rate: 66.7%
- Unemployment Rate: 4.6%
- Quit Rate: 1.8%
- Hiring Rate: 3.2%
Michigan
-
1.24
Michigan's Worker Shortage Index
- Job Openings: 225,000
- Unemployed Workers: 277,879
- Labor Force Participation Rate: 62.0%
- Unemployment Rate: 5.5%
- Quit Rate: 2.1%
- Hiring Rate: 4.5%
Minnesota
-
0.53
Minnesota's Worker Shortage Index
- Job Openings: 187,000
- Unemployed Workers: 100,039
- Labor Force Participation Rate: 68.2%
- Unemployment Rate: 3.2%
- Quit Rate: 2.1%
- Hiring Rate: 3.5%
Mississippi
-
0.85
Mississippi's Worker Shortage Index
- Job Openings: 61,000
- Unemployed Workers: 52,084
- Labor Force Participation Rate: 56.2%
- Unemployment Rate: 4.0%
- Quit Rate: 2.1%
- Hiring Rate: 3.5%
Missouri
-
0.86
Missouri's Worker Shortage Index
- Job Openings: 145,000
- Unemployed Workers: 124,132
- Labor Force Participation Rate: 63.4%
- Unemployment Rate: 3.9%
- Quit Rate: 2.1%
- Hiring Rate: 3.1%
Montana
-
0.54
Montana's Worker Shortage Index
- Job Openings: 29,000
- Unemployed Workers: 15,697
- Labor Force Participation Rate: 62.3%
- Unemployment Rate: 2.7%
- Quit Rate: 3.0%
- Hiring Rate: 4.9%
Nebraska
-
0.66
Nebraska's Worker Shortage Index
- Job Openings: 49,000
- Unemployed Workers: 32,249
- Labor Force Participation Rate: 69.3%
- Unemployment Rate: 3.0%
- Quit Rate: 2.1%
- Hiring Rate: 3.6%
Nevada
-
1.38
Nevada's Worker Shortage Index
- Job Openings: 68,000
- Unemployed Workers: 93,534
- Labor Force Participation Rate: 62.9%
- Unemployment Rate: 5.6%
- Quit Rate: 2.1%
- Hiring Rate: 3.8%
New Hampshire
-
0.83
New Hampshire's Worker Shortage Index
- Job Openings: 29,000
- Unemployed Workers: 24,170
- Labor Force Participation Rate: 65.7%
- Unemployment Rate: 3.1%
- Quit Rate: 2.0%
- Hiring Rate: 3.4%
New Jersey
-
1.10
New Jersey's Worker Shortage Index
- Job Openings: 213,000
- Unemployed Workers: 234,394
- Labor Force Participation Rate: 63.9%
- Unemployment Rate: 4.8%
- Quit Rate: 1.7%
- Hiring Rate: 3.5%
New Mexico
-
0.96
New Mexico's Worker Shortage Index
- Job Openings: 44,000
- Unemployed Workers: 42,131
- Labor Force Participation Rate: 57.8%
- Unemployment Rate: 4.3%
- Quit Rate: 2.1%
- Hiring Rate: 3.4%
New York
-
0.95
New York's Worker Shortage Index
- Job Openings: 430,000
- Unemployed Workers: 410,366
- Labor Force Participation Rate: 61.0%
- Unemployment Rate: 4.2%
- Quit Rate: 1.5%
- Hiring Rate: 2.8%
North Carolina
-
0.77
North Carolina's Worker Shortage Index
- Job Openings: 255,000
- Unemployed Workers: 196,360
- Labor Force Participation Rate: 59.6%
- Unemployment Rate: 3.7%
- Quit Rate: 2.0%
- Hiring Rate: 3.0%
North Dakota
-
0.46
North Dakota's Worker Shortage Index
- Job Openings: 24,000
- Unemployed Workers: 11,009
- Labor Force Participation Rate: 69.5%
- Unemployment Rate: 2.6%
- Quit Rate: 2.4%
- Hiring Rate: 3.8%
Ohio
-
0.98
Ohio's Worker Shortage Index
- Job Openings: 296,000
- Unemployed Workers: 291,306
- Labor Force Participation Rate: 62.7%
- Unemployment Rate: 4.9%
- Quit Rate: 2.2%
- Hiring Rate: 3.4%
Oklahoma
-
0.69
Oklahoma's Worker Shortage Index
- Job Openings: 93,000
- Unemployed Workers: 64,249
- Labor Force Participation Rate: 62.6%
- Unemployment Rate: 3.2%
- Quit Rate: 2.3%
- Hiring Rate: 3.6%
Oregon
-
1.12
Oregon's Worker Shortage Index
- Job Openings: 92,000
- Unemployed Workers: 103,325
- Labor Force Participation Rate: 62.7%
- Unemployment Rate: 4.7%
- Quit Rate: 2.1%
- Hiring Rate: 3.3%
Pennsylvania
-
0.96
Pennsylvania's Worker Shortage Index
- Job Openings: 265,000
- Unemployed Workers: 255,589
- Labor Force Participation Rate: 61.6%
- Unemployment Rate: 3.9%
- Quit Rate: 1.5%
- Hiring Rate: 2.7%
Rhode Island
-
1.31
Rhode Island's Worker Shortage Index
- Job Openings: 22,000
- Unemployed Workers: 28,829
- Labor Force Participation Rate: 63.8%
- Unemployment Rate: 4.9%
- Quit Rate: 2.1%
- Hiring Rate: 3.5%
South Carolina
-
0.91
South Carolina's Worker Shortage Index
- Job Openings: 117,000
- Unemployed Workers: 106,498
- Labor Force Participation Rate: 57.5%
- Unemployment Rate: 4.2%
- Quit Rate: 2.3%
- Hiring Rate: 4.0%
South Dakota
-
0.41
South Dakota's Worker Shortage Index
- Job Openings: 22,000
- Unemployed Workers: 9,049
- Labor Force Participation Rate: 68.9%
- Unemployment Rate: 1.8%
- Quit Rate: 2.8%
- Hiring Rate: 3.8%
Tennessee
-
0.73
Tennessee's Worker Shortage Index
- Job Openings: 167,000
- Unemployed Workers: 122,290
- Labor Force Participation Rate: 59.7%
- Unemployment Rate: 3.5%
- Quit Rate: 2.3%
- Hiring Rate: 3.7%
Texas
-
1.15
Texas's Worker Shortage Index
- Job Openings: 558,000
- Unemployed Workers: 642,922
- Labor Force Participation Rate: 64.9%
- Unemployment Rate: 4.1%
- Quit Rate: 2.3%
- Hiring Rate: 3.7%
Utah
-
0.76
Utah's Worker Shortage Index
- Job Openings: 76,000
- Unemployed Workers: 57,518
- Labor Force Participation Rate: 68.3%
- Unemployment Rate: 3.1%
- Quit Rate: 2.2%
- Hiring Rate: 3.8%
Vermont
-
0.73
Vermont's Worker Shortage Index
- Job Openings: 13,000
- Unemployed Workers: 9,426
- Labor Force Participation Rate: 65.1%
- Unemployment Rate: 2.7%
- Quit Rate: 2.2%
- Hiring Rate: 3.8%
Virginia
-
0.69
Virginia's Worker Shortage Index
- Job Openings: 221,000
- Unemployed Workers: 151,942
- Labor Force Participation Rate: 65.4%
- Unemployment Rate: 3.3%
- Quit Rate: 2.1%
- Hiring Rate: 3.3%
Washington
-
1.28
Washington's Worker Shortage Index
- Job Openings: 140,000
- Unemployed Workers: 179,187
- Labor Force Participation Rate: 62.7%
- Unemployment Rate: 4.4%
- Quit Rate: 1.5%
- Hiring Rate: 3.0%
West Virginia
-
0.84
West Virginia's Worker Shortage Index
- Job Openings: 35,000
- Unemployed Workers: 29,441
- Labor Force Participation Rate: 54.3%
- Unemployment Rate: 3.8%
- Quit Rate: 2.5%
- Hiring Rate: 3.5%
Wisconsin
-
0.71
Wisconsin's Worker Shortage Index
- Job Openings: 146,000
- Unemployed Workers: 103,411
- Labor Force Participation Rate: 65.5%
- Unemployment Rate: 3.3%
- Quit Rate: 2.1%
- Hiring Rate: 3.5%
Wyoming
-
0.69
Wyoming's Worker Shortage Index
- Job Openings: 14,000
- Unemployed Workers: 9,714
- Labor Force Participation Rate: 62.5%
- Unemployment Rate: 3.3%
- Quit Rate: 2.7%
- Hiring Rate: 4.7%
The Chamber’s Worker Shortage Index ratio indicates the number of available workers for every job opening. A ratio above 1.0 indicates a surplus of available workers compared to job openings.
Vermont’s Labor Market
Prior to the pandemic, Vermont’s labor market was stable. The state only had 58 workers for every 100 open jobs. However, the state's unemployment rate was far lower than the national figure at 3.5%, and its labor force participation rate was marginally higher than the national rate of 63.4%.
As of August 2023, Vermont’s current labor market had not yet recovered. While the Green Mountain State boasts a notably low unemployment rate, it's labor force participation rate is two full percentage points lower than it was in February 2020. This is particularly concerning for employers, who have a surplus of 19,000 job openings among a labor shortage.
The state’s worker shortage lags far behind both its pre-pandemic levels and the nation’s current average, with only 36 available workers for every 100 open job positions in the state.
Vermont’s Business Environment
Vermont's business environment is marked by tourism and home to a handful of iconic American brands. The state is a popular tourist destination, bolstering the state’s numerous retail and wholesale trade businesses which employ 30,000 people.
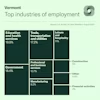
Among the industries monitored by the Bureau of Labor Statistics, the professional and business services sector, as well as the government sector, employ the highest number of Vermonters, while the construction sector employs the fewest. Vermont’s employment landscape consists of prominent cyber-security and broadband firms, in addition to multiple companies offering media and software services.
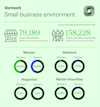
Vermont is home to a thriving small business ecosystem, with 99% of all Vermont businesses falling into this category. Nearly two-thirds of Utah's workforce work within small businesses. Within this dynamic landscape, women own half 41.8% of small businesses, 2.4% are minority-owned, 1.2% are owned by Hispanics, and 7.5% are veteran-owned.
Vermont’s Educational Attainment
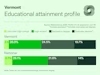
Ninety-five percent of Vermont’s population has obtained their high school diploma or its equivalent, five percentage points higher than the national average in 2022. 44.2% of the population has attained a bachelor's degree, while over 19% have secured a graduate degree, both above the national averages.
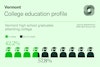
Less than half of Vermont high school graduates stay in the state to attend college where the average in-state tuition is $17,083. Out-of-state tuition in the Green Mountain state is $41,057, significantly more expensive than the national average out-of-state tuition of $28,000. Roughly 40,000 students are enrolled in a Vermont college for the 2022-2023 school year. These students supply a rich talent pool from which local employers can recruit talent.
Quality of Life
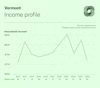
Vermont’s median household income is relatively volatile, but its current median income of $72,190 puts it on par with the national average of $70,000, ranking 33rd in the country. Vermont has a graduated tax rate system, ranging from 3.35% to 8.75%, which places the state among those with some of the highest tax rates.
Vermont has a graduated tax rate system, ranging from 3.35% to 8.75%, which places the state among those with some of the highest tax rates.
Around 34% of Vermont workers work remote at least one day a week. For those commuting into an office, the average commute time is 23 minutes. The Council for Community and Economic Research measures states’ costs of living compared to the national average of 100. Vermont’s cost of living index falls at 114.9 meaning the state more expensive in comparison to the national cost of living. The median rent settles at $999, while the median home cost is $383,882, slightly higher than the national average. 72% of the population owned their housing unit in 2021. The state experienced a low growth rate of .65% from 2020 to 2022.
Immigration
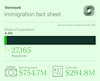
In the U.S., immigrants tend to be of working age in comparison to native-born individuals. As workers, these immigrants are also contributing to support programs like Medicare and Social Security.
Looking at Vermont in particular, immigrants comprise 4.4% of the state's population, totaling 27,165 individuals. Their collective spending power amounts to $754.7 million, while their tax contributions reach $294.8 million.
Explore More States


About the authors

Makinizi Hoover
Makinizi Hoover is Housing Policy Lead at the U.S. Chamber of Commerce, where she leads the Chamber’s work to advance supply-side reforms that improve housing affordability and availability.
Stephanie Ferguson Melhorn
Stephanie Ferguson Melhorn is the Executive Director, Workforce and International Labor Policy. Her work on the labor shortage has been cited in the Wall Street Journal, Washington Post, and Associated Press.

Isabella Lucy
Isabella has created stunning visualizations tackling pressing issues like the worker shortage, the benefits of hiring veterans, the lifespan of small businesses, and the future of work.