Makinizi Hoover Makinizi Hoover
Senior Manager, Strategic Advocacy, U.S. Chamber of Commerce
Stephanie Ferguson Stephanie Ferguson
Director, Global Employment Policy & Special Initiatives, U.S. Chamber of Commerce
Isabella Lucy Isabella Lucy
Graphic Designer, U.S. Chamber of Commerce

Published

September 15, 2023

Share

The state of New Hampshire has a favorable landscape for businesses and individuals, with a diverse economy, strong labor market recovery, and a robust small business ecosystem. Educational attainment, quality of life, and income-based factors remain promising. 

The Worker Shortage Across America

Explore the interactive map below to see the impact of the worker shortage crisis in each state.

Least severe
Severe
More severe
Most severe

Alabama

  • 0.38
    Alabama's Worker Shortage Index
  • Job Openings: 129,000
  • Unemployed Workers: 48,590
  • Labor Force Participation Rate: 57.0%
  • Unemployment Rate: 2.1%
  • Quit Rate: 2.9%
  • Hiring Rate: 4.5%

Alaska

  • 0.59
    Alaska's Worker Shortage Index
  • Job Openings: 24,000
  • Unemployed Workers: 14,081
  • Labor Force Participation Rate: 65.2%
  • Unemployment Rate: 3.9%
  • Quit Rate: 3.4%
  • Hiring Rate: 4.9%

Arizona

  • 0.71
    Arizona's Worker Shortage Index
  • Job Openings: 199,000
  • Unemployed Workers: 141,617
  • Labor Force Participation Rate: 61.8%
  • Unemployment Rate: 3.8%
  • Quit Rate: 3.0%
  • Hiring Rate: 4.0%

Arkansas

  • 0.44
    Arkansas's Worker Shortage Index
  • Job Openings: 84,000
  • Unemployed Workers: 37,339
  • Labor Force Participation Rate: 57.7%
  • Unemployment Rate: 2.7%
  • Quit Rate: 2.7%
  • Hiring Rate: 4.3%

California

  • 0.92
    California's Worker Shortage Index
  • Job Openings: 975,000
  • Unemployed Workers: 895,044
  • Labor Force Participation Rate: 62.4%
  • Unemployment Rate: 4.6%
  • Quit Rate: 1.7%
  • Hiring Rate: 3.4%

Colorado

  • 0.52
    Colorado's Worker Shortage Index
  • Job Openings: 191,000
  • Unemployed Workers: 99,856
  • Labor Force Participation Rate: 68.7%
  • Unemployment Rate: 3.1%
  • Quit Rate: 2.3%
  • Hiring Rate: 3.0%

Connecticut

  • 0.74
    Connecticut's Worker Shortage Index
  • Job Openings: 91,000
  • Unemployed Workers: 67,253
  • Labor Force Participation Rate: 64.1%
  • Unemployment Rate: 3.5%
  • Quit Rate: 2.0%
  • Hiring Rate: 3.6%

Delaware

  • 0.63
    Delaware's Worker Shortage Index
  • Job Openings: 33,000
  • Unemployed Workers: 20,812
  • Labor Force Participation Rate: 60.3%
  • Unemployment Rate: 4.1%
  • Quit Rate: 3.1%
  • Hiring Rate: 5.4%

District of Columbia

  • 0.45
    District of Columbia's Worker Shortage Index
  • Job Openings: 43,000
  • Unemployed Workers: 19,519
  • Labor Force Participation Rate: 70.9%
  • Unemployment Rate: 5.0%
  • Quit Rate: 2.1%
  • Hiring Rate: 3.4%

Florida

  • 0.53
    Florida's Worker Shortage Index
  • Job Openings: 570,000
  • Unemployed Workers: 302,949
  • Labor Force Participation Rate: 59.7%
  • Unemployment Rate: 2.7%
  • Quit Rate: 2.8%
  • Hiring Rate: 4.0%

Georgia

  • 0.54
    Georgia's Worker Shortage Index
  • Job Openings: 323,000
  • Unemployed Workers: 174,106
  • Labor Force Participation Rate: 61.4%
  • Unemployment Rate: 3.3%
  • Quit Rate: 2.9%
  • Hiring Rate: 4.8%

Hawaii

  • 0.58
    Hawaii's Worker Shortage Index
  • Job Openings: 33,000
  • Unemployed Workers: 19,024
  • Labor Force Participation Rate: 60.2%
  • Unemployment Rate: 2.8%
  • Quit Rate: 1.9%
  • Hiring Rate: 3.3%

Idaho

  • 0.53
    Idaho's Worker Shortage Index
  • Job Openings: 55,000
  • Unemployed Workers: 28,947
  • Labor Force Participation Rate: 62.4%
  • Unemployment Rate: 3.0%
  • Quit Rate: 2.9%
  • Hiring Rate: 4.5%

Illinois

  • 0.76
    Illinois's Worker Shortage Index
  • Job Openings: 349,000
  • Unemployed Workers: 266,155
  • Labor Force Participation Rate: 64.4%
  • Unemployment Rate: 4.1%
  • Quit Rate: 1.8%
  • Hiring Rate: 3.4%

Indiana

  • 0.72
    Indiana's Worker Shortage Index
  • Job Openings: 162,000
  • Unemployed Workers: 117,400
  • Labor Force Participation Rate: 63.5%
  • Unemployment Rate: 3.4%
  • Quit Rate: 2.6%
  • Hiring Rate: 4.2%

Iowa

  • 0.67
    Iowa's Worker Shortage Index
  • Job Openings: 75,000
  • Unemployed Workers: 50,242
  • Labor Force Participation Rate: 68.7%
  • Unemployment Rate: 2.9%
  • Quit Rate: 2.4%
  • Hiring Rate: 3.3%

Kansas

  • 0.51
    Kansas's Worker Shortage Index
  • Job Openings: 82,000
  • Unemployed Workers: 41,743
  • Labor Force Participation Rate: 66.7%
  • Unemployment Rate: 2.7%
  • Quit Rate: 2.1%
  • Hiring Rate: 3.9%

Kentucky

  • 0.74
    Kentucky's Worker Shortage Index
  • Job Openings: 111,000
  • Unemployed Workers: 82,001
  • Labor Force Participation Rate: 57.6%
  • Unemployment Rate: 4.0%
  • Quit Rate: 2.9%
  • Hiring Rate: 4.1%

Louisiana

  • 0.55
    Louisiana's Worker Shortage Index
  • Job Openings: 126,000
  • Unemployed Workers: 68,804
  • Labor Force Participation Rate: 59.0%
  • Unemployment Rate: 3.3%
  • Quit Rate: 3.0%
  • Hiring Rate: 5.7%

Maine

  • 0.42
    Maine's Worker Shortage Index
  • Job Openings: 41,000
  • Unemployed Workers: 17,148
  • Labor Force Participation Rate: 58.6%
  • Unemployment Rate: 2.5%
  • Quit Rate: 1.7%
  • Hiring Rate: 3.6%

Maryland

  • 0.33
    Maryland's Worker Shortage Index
  • Job Openings: 165,000
  • Unemployed Workers: 54,778
  • Labor Force Participation Rate: 65.3%
  • Unemployment Rate: 1.7%
  • Quit Rate: 2.3%
  • Hiring Rate: 4.0%

Massachusetts

  • 0.42
    Massachusetts's Worker Shortage Index
  • Job Openings: 236,000
  • Unemployed Workers: 98,262
  • Labor Force Participation Rate: 64.5%
  • Unemployment Rate: 2.6%
  • Quit Rate: 1.3%
  • Hiring Rate: 3.2%

Michigan

  • 0.85
    Michigan's Worker Shortage Index
  • Job Openings: 216,000
  • Unemployed Workers: 183,249
  • Labor Force Participation Rate: 61.3%
  • Unemployment Rate: 3.7%
  • Quit Rate: 2.1%
  • Hiring Rate: 3.7%

Minnesota

  • 0.51
    Minnesota's Worker Shortage Index
  • Job Openings: 192,000
  • Unemployed Workers: 97,053
  • Labor Force Participation Rate: 68.5%
  • Unemployment Rate: 3.1%
  • Quit Rate: 2.3%
  • Hiring Rate: 3.5%

Mississippi

  • 0.49
    Mississippi's Worker Shortage Index
  • Job Openings: 80,000
  • Unemployed Workers: 39,159
  • Labor Force Participation Rate: 54.3%
  • Unemployment Rate: 3.2%
  • Quit Rate: 3.2%
  • Hiring Rate: 4.9%

Missouri

  • 0.53
    Missouri's Worker Shortage Index
  • Job Openings: 167,000
  • Unemployed Workers: 87,977
  • Labor Force Participation Rate: 63.7%
  • Unemployment Rate: 2.8%
  • Quit Rate: 2.2%
  • Hiring Rate: 3.3%

Montana

  • 0.42
    Montana's Worker Shortage Index
  • Job Openings: 35,000
  • Unemployed Workers: 14,691
  • Labor Force Participation Rate: 62.7%
  • Unemployment Rate: 2.5%
  • Quit Rate: 3.1%
  • Hiring Rate: 4.8%

Nebraska

  • 0.39
    Nebraska's Worker Shortage Index
  • Job Openings: 54,000
  • Unemployed Workers: 21,145
  • Labor Force Participation Rate: 69.2%
  • Unemployment Rate: 2.0%
  • Quit Rate: 2.3%
  • Hiring Rate: 3.6%

Nevada

  • 0.93
    Nevada's Worker Shortage Index
  • Job Openings: 92,000
  • Unemployed Workers: 85,620
  • Labor Force Participation Rate: 61.7%
  • Unemployment Rate: 5.4%
  • Quit Rate: 2.6%
  • Hiring Rate: 4.1%

New Hampshire

  • 0.28
    New Hampshire's Worker Shortage Index
  • Job Openings: 50,000
  • Unemployed Workers: 13,782
  • Labor Force Participation Rate: 64.6%
  • Unemployment Rate: 1.8%
  • Quit Rate: 2.1%
  • Hiring Rate: 4.2%

New Jersey

  • 0.84
    New Jersey's Worker Shortage Index
  • Job Openings: 243,000
  • Unemployed Workers: 203,340
  • Labor Force Participation Rate: 65.5%
  • Unemployment Rate: 4.2%
  • Quit Rate: 2.1%
  • Hiring Rate: 3.4%

New Mexico

  • 0.55
    New Mexico's Worker Shortage Index
  • Job Openings: 65,000
  • Unemployed Workers: 35,840
  • Labor Force Participation Rate: 57.2%
  • Unemployment Rate: 3.7%
  • Quit Rate: 2.4%
  • Hiring Rate: 4.5%

New York

  • 0.87
    New York's Worker Shortage Index
  • Job Openings: 441,000
  • Unemployed Workers: 384,655
  • Labor Force Participation Rate: 61.5%
  • Unemployment Rate: 3.9%
  • Quit Rate: 1.4%
  • Hiring Rate: 3.0%

North Carolina

  • 0.55
    North Carolina's Worker Shortage Index
  • Job Openings: 316,000
  • Unemployed Workers: 173,531
  • Labor Force Participation Rate: 60.8%
  • Unemployment Rate: 3.3%
  • Quit Rate: 2.7%
  • Hiring Rate: 3.7%

North Dakota

  • 0.30
    North Dakota's Worker Shortage Index
  • Job Openings: 26,000
  • Unemployed Workers: 7,890
  • Labor Force Participation Rate: 69.5%
  • Unemployment Rate: 1.9%
  • Quit Rate: 2.5%
  • Hiring Rate: 3.9%

Ohio

  • 0.62
    Ohio's Worker Shortage Index
  • Job Openings: 314,000
  • Unemployed Workers: 195,642
  • Labor Force Participation Rate: 62.1%
  • Unemployment Rate: 3.4%
  • Quit Rate: 2.4%
  • Hiring Rate: 3.4%

Oklahoma

  • 0.52
    Oklahoma's Worker Shortage Index
  • Job Openings: 104,000
  • Unemployed Workers: 54,368
  • Labor Force Participation Rate: 61.8%
  • Unemployment Rate: 2.8%
  • Quit Rate: 2.9%
  • Hiring Rate: 4.9%

Oregon

  • 0.66
    Oregon's Worker Shortage Index
  • Job Openings: 111,000
  • Unemployed Workers: 73,506
  • Labor Force Participation Rate: 61.7%
  • Unemployment Rate: 3.4%
  • Quit Rate: 2.3%
  • Hiring Rate: 3.5%

Pennsylvania

  • 0.66
    Pennsylvania's Worker Shortage Index
  • Job Openings: 342,000
  • Unemployed Workers: 226,208
  • Labor Force Participation Rate: 61.9%
  • Unemployment Rate: 3.5%
  • Quit Rate: 2.0%
  • Hiring Rate: 2.9%

Rhode Island

  • 0.53
    Rhode Island's Worker Shortage Index
  • Job Openings: 29,000
  • Unemployed Workers: 15,232
  • Labor Force Participation Rate: 63.3%
  • Unemployment Rate: 2.7%
  • Quit Rate: 1.8%
  • Hiring Rate: 3.9%

South Carolina

  • 0.43
    South Carolina's Worker Shortage Index
  • Job Openings: 168,000
  • Unemployed Workers: 73,016
  • Labor Force Participation Rate: 57.0%
  • Unemployment Rate: 3.0%
  • Quit Rate: 3.0%
  • Hiring Rate: 4.3%

South Dakota

  • 0.36
    South Dakota's Worker Shortage Index
  • Job Openings: 25,000
  • Unemployed Workers: 9,073
  • Labor Force Participation Rate: 67.8%
  • Unemployment Rate: 1.9%
  • Quit Rate: 2.6%
  • Hiring Rate: 3.9%

Tennessee

  • 0.56
    Tennessee's Worker Shortage Index
  • Job Openings: 189,000
  • Unemployed Workers: 105,102
  • Labor Force Participation Rate: 59.4%
  • Unemployment Rate: 3.1%
  • Quit Rate: 2.9%
  • Hiring Rate: 4.8%

Texas

  • 0.80
    Texas's Worker Shortage Index
  • Job Openings: 774,000
  • Unemployed Workers: 622,845
  • Labor Force Participation Rate: 64.2%
  • Unemployment Rate: 4.1%
  • Quit Rate: 2.7%
  • Hiring Rate: 3.8%

Utah

  • 0.44
    Utah's Worker Shortage Index
  • Job Openings: 105,000
  • Unemployed Workers: 45,772
  • Labor Force Participation Rate: 69.8%
  • Unemployment Rate: 2.5%
  • Quit Rate: 2.8%
  • Hiring Rate: 3.7%

Vermont

  • 0.36
    Vermont's Worker Shortage Index
  • Job Openings: 18,000
  • Unemployed Workers: 6,407
  • Labor Force Participation Rate: 64.0%
  • Unemployment Rate: 1.8%
  • Quit Rate: 2.3%
  • Hiring Rate: 3.6%

Virginia

  • 0.47
    Virginia's Worker Shortage Index
  • Job Openings: 243,000
  • Unemployed Workers: 113,102
  • Labor Force Participation Rate: 66.7%
  • Unemployment Rate: 2.5%
  • Quit Rate: 2.6%
  • Hiring Rate: 4.3%

Washington

  • 0.77
    Washington's Worker Shortage Index
  • Job Openings: 189,000
  • Unemployed Workers: 145,895
  • Labor Force Participation Rate: 64.6%
  • Unemployment Rate: 3.6%
  • Quit Rate: 2.2%
  • Hiring Rate: 3.4%

West Virginia

  • 0.54
    West Virginia's Worker Shortage Index
  • Job Openings: 52,000
  • Unemployed Workers: 28,256
  • Labor Force Participation Rate: 54.9%
  • Unemployment Rate: 3.6%
  • Quit Rate: 3.3%
  • Hiring Rate: 5.1%

Wisconsin

  • 0.54
    Wisconsin's Worker Shortage Index
  • Job Openings: 165,000
  • Unemployed Workers: 89,517
  • Labor Force Participation Rate: 65.7%
  • Unemployment Rate: 2.9%
  • Quit Rate: 2.3%
  • Hiring Rate: 3.3%

Wyoming

  • 0.46
    Wyoming's Worker Shortage Index
  • Job Openings: 19,000
  • Unemployed Workers: 8,739
  • Labor Force Participation Rate: 64.5%
  • Unemployment Rate: 2.9%
  • Quit Rate: 3.1%
  • Hiring Rate: 4.5%

The Chamber’s Worker Shortage Index ratio indicates the number of available workers for every job opening. A ratio above 1.0 indicates a surplus of available workers compared to job openings.

New Hampshire’s Labor Market 

Prior to the pandemic, New Hampshire’s labor market was relatively healthy. While the state only had 75 workers per 100 jobs, the state's unemployment rate stood well below the national figure of 3.5%. It's labor force participation rate was higher than the national rate of 63.4%. 

As of August 2023, New Hampshire’s labor market had not yet fully recovered, but is displaying signs of improvement. While the state's labor force participation rate still lags behind its pre-pandemic levels, it still stands above the national average.  New Hampshire’s unemployment rate is significantly lower than it was before the pandemic.

On the downside, New Hampshire is heavily grappling with a severe workforce shortage, evident by the fact that there are only 28 available workers for every 100 open job positions in the state.   

New Hampshire’s Business Environment 

New Hampshire's business environment is diverse, encompassing a robust manufacturing sector, the largest legislative body in the nation, prestigious universities, and a thriving retail market. 

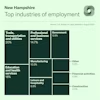
Among the industries monitored by the Bureau of Labor Statistics, the trade, transportation, and utilities sector, as well as the education and health services sector, employ the highest number of New Hampshirites, while the construction sector employs the fewest. New Hampshire’s employment landscape comes from its multiple apparel and fashion companies, in addition to the numerous private and public universities within the state. 

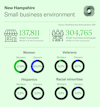
New Hampshire boasts a thriving small business ecosystem, with 99% of all New Hampshire businesses falling into this category. Nearly half of New Hampshire's workforce works within small businesses. Within this dynamic landscape, women own 40% of small businesses, 3% are minority-owned, 2% are owned by Hispanics, and 8.7% are veteran-owned. 

New Hampshire’s Educational Attainment 

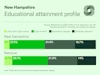
Nearly 95% of New Hampshire’s population has obtained their high school diploma or its equivalent, five percentage points above the national average in 2022. 41.3% of the population have attained a bachelor's degree, while 16.7% have secured a graduate degree, both above the national average. 

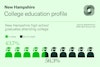
Slightly less than half of incoming college freshmen are remaining in the state for their higher education, where the average in-state tuition is $16,679. Out-of-state tuition in the Granite state is $30,594, slightly more expensive than the national average out-of-state tuition of $28,000. Roughly 198,000 students are enrolled in a New Hampshire college for the 2022-2023 school year. These students supply a rich talent pool from which local employers can recruit talent.  

Quality of Life 

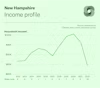
New Hampshire has a median household income of $84,970, surpassing the national median average of approximately $70,000. This positions the state at 15th place among all states, although it experienced a significant decline in the past year. New Hampshire maintains a modest tax rate of 5%, employing a flat-rate structure that exclusively taxes income. This places it among the states with comparatively lower tax rates. 

One-third of New Hampshire’s workforce work remote at least one day a week. For those commuting into an office, the average commute time is 27.1 minutes. The Council for Community and Economic Research measures states’ costs of living compared to the national average of 100. New Hampshire’s cost of living index falls at 115, meaning the state is less affordable in comparison to the national cost of living. The median rent settles at $1,145, while the median home cost is $467,775, both above the national average. Nearly 71.6% of the population owned their housing unit in 2021. The state experienced a growth rate of 1.21% from 2020 to 2022.  

Immigration 

In the U.S., immigrants tend to be of working age in comparison to native-born individuals. As workers, these immigrants are also contributing to support programs like Medicare and Social Security.

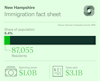
Looking at New Hampshire in particular, immigrants comprise 6.4% of the state's population, totaling 87,055 individuals. Their collective spending power amounts to one billion dollars, while their tax contributions reach $3.1 billion. 

Explore More States

    About the authors

    Makinizi Hoover

    Makinizi Hoover

    Makinizi Hoover is the Senior Manager of Strategic Advocacy at the U.S. Chamber of Commerce. Her work includes the development and project management of comprehensive data centers that serve as a valuable resource for policymakers, businesses, and the public.

    Read more

    Stephanie Ferguson

    Stephanie Ferguson

    Stephanie Ferguson is the Director of Global Employment Policy & Special Initiatives. Her work on the labor shortage has been cited in the Wall Street Journal, Washington Post, and Associated Press.

    Read more

    Isabella Lucy

    Isabella Lucy

    Isabella has created stunning visualizations tackling pressing issues like the worker shortage, the benefits of hiring veterans, the lifespan of small businesses, and the future of work.

    Read more