Jenna Shrove Jenna Shrove
Executive Director of Strategic Advocacy and Advisor to the Chief Policy Officer
Stephanie Ferguson Stephanie Ferguson
Director, Global Employment Policy & Special Initiatives, U.S. Chamber of Commerce
Isabella Lucy Isabella Lucy
Graphic Designer, U.S. Chamber of Commerce

Published

October 26, 2022

Share

The inequality of opportunity has left a lasting mark on the United States and has had a disproportional impact on people of color. The path forward requires us to take a step back and reevaluate how we look at equal access to employment, education, entrepreneurship, health, wealth, and criminal justice. If we are to protect the United States’ social and economic fabric, we must work diligently to address these long-standing racial disparities. 

The U.S. Chamber of Commerce launched the Equality of Opportunity Initiative in 2020 to address opportunity gaps that perpetuate broader inequalities in our society and hold back individual and business success and economic growth. To drive meaningful, measurable impact through public policy and private sector solutions, we must listen, learn, and lead. 

We compiled this research to show the magnitude of opportunity gaps in six key areas. The findings below have informed our work as we continue to pursue targeted, data-driven, and sustainable solutions that will help deliver the American promise of equal opportunity to all. 


EDUCATION

Differences in proficiency rates between White and Black students, dubbed the “achievement gap,” begins before formal schooling and persists through K-12 education and beyond. These educational gaps perpetuate inequalities in employment, income, and wealth creation. 

The U.S. high school graduation rates for adults aged 18-24 has risen over the last two decades, averaging about 85%. Despite the success in the educational milestone, the graduation rate for Black students has consistently lagged that of White students. 

Black Americans are also below the national average, with roughly 43% attaining a high school degree or less (6 percentage points less than the national average) and only 28% receiving a bachelor’s degree or higher, compared to 38% of all Americans. The achievement gap does persist, however, compared to the educational attainment rates of 2019, more Black students are obtaining high school diplomas. 

Figure 1. Source: Table 3. Detailed Years of School Completed by People 25 Years and Over by Sex, Age Groups, Race and Hispanic Origin: 2021. U.S. Bureau of Labor Statistics.

Figure 1 shows the educational attainment of non-institutionalized adults over the age of 25. The educational attainment of White adults is reflective of the national average. Asian Americans obtain college degrees at twice the rate of Black Americans. Black Americans are less likely to have completed a high school or college diploma than their White and Asian counterparts. 

Educational attainment is one of the earliest indications of future income and wealth. Most often, individuals with college degrees will out earn those with only a high school diploma. Those with a high school level education also out earn peers who did not graduate from high school.  


EMPLOYMENT

For the vast majority of Americans, employment is a critical determinant of family income and plays a role in a family’s ability to build wealth across a generation. The importance of a job to a family and a community is evident. 

Black unemployment rates have been consistently twice as high as White unemployment for the past four decades. In August 2022, the White unemployment rate was 3.2%, but 6.4% among Black Americans. 

Unemployment Rates in August 2022

  • 6.4%
    Black
  • 3.2%
    White
  • 4.5%
    Hispanic
  • 2.8%
    Asian
Figure 2
Figure 2

Workforce Breakdown (2021)

  • 77.5%
    White
  • 12.3%
    Black
  • 6.6%
    Asian
  • 18%
    Hispanic
Figure 3. Source: BLS Current Population Survey. Table 18: Employed persons by detailed industry, sex, race, and Hispanic or Latino ethnicity (Numbers in thousands)

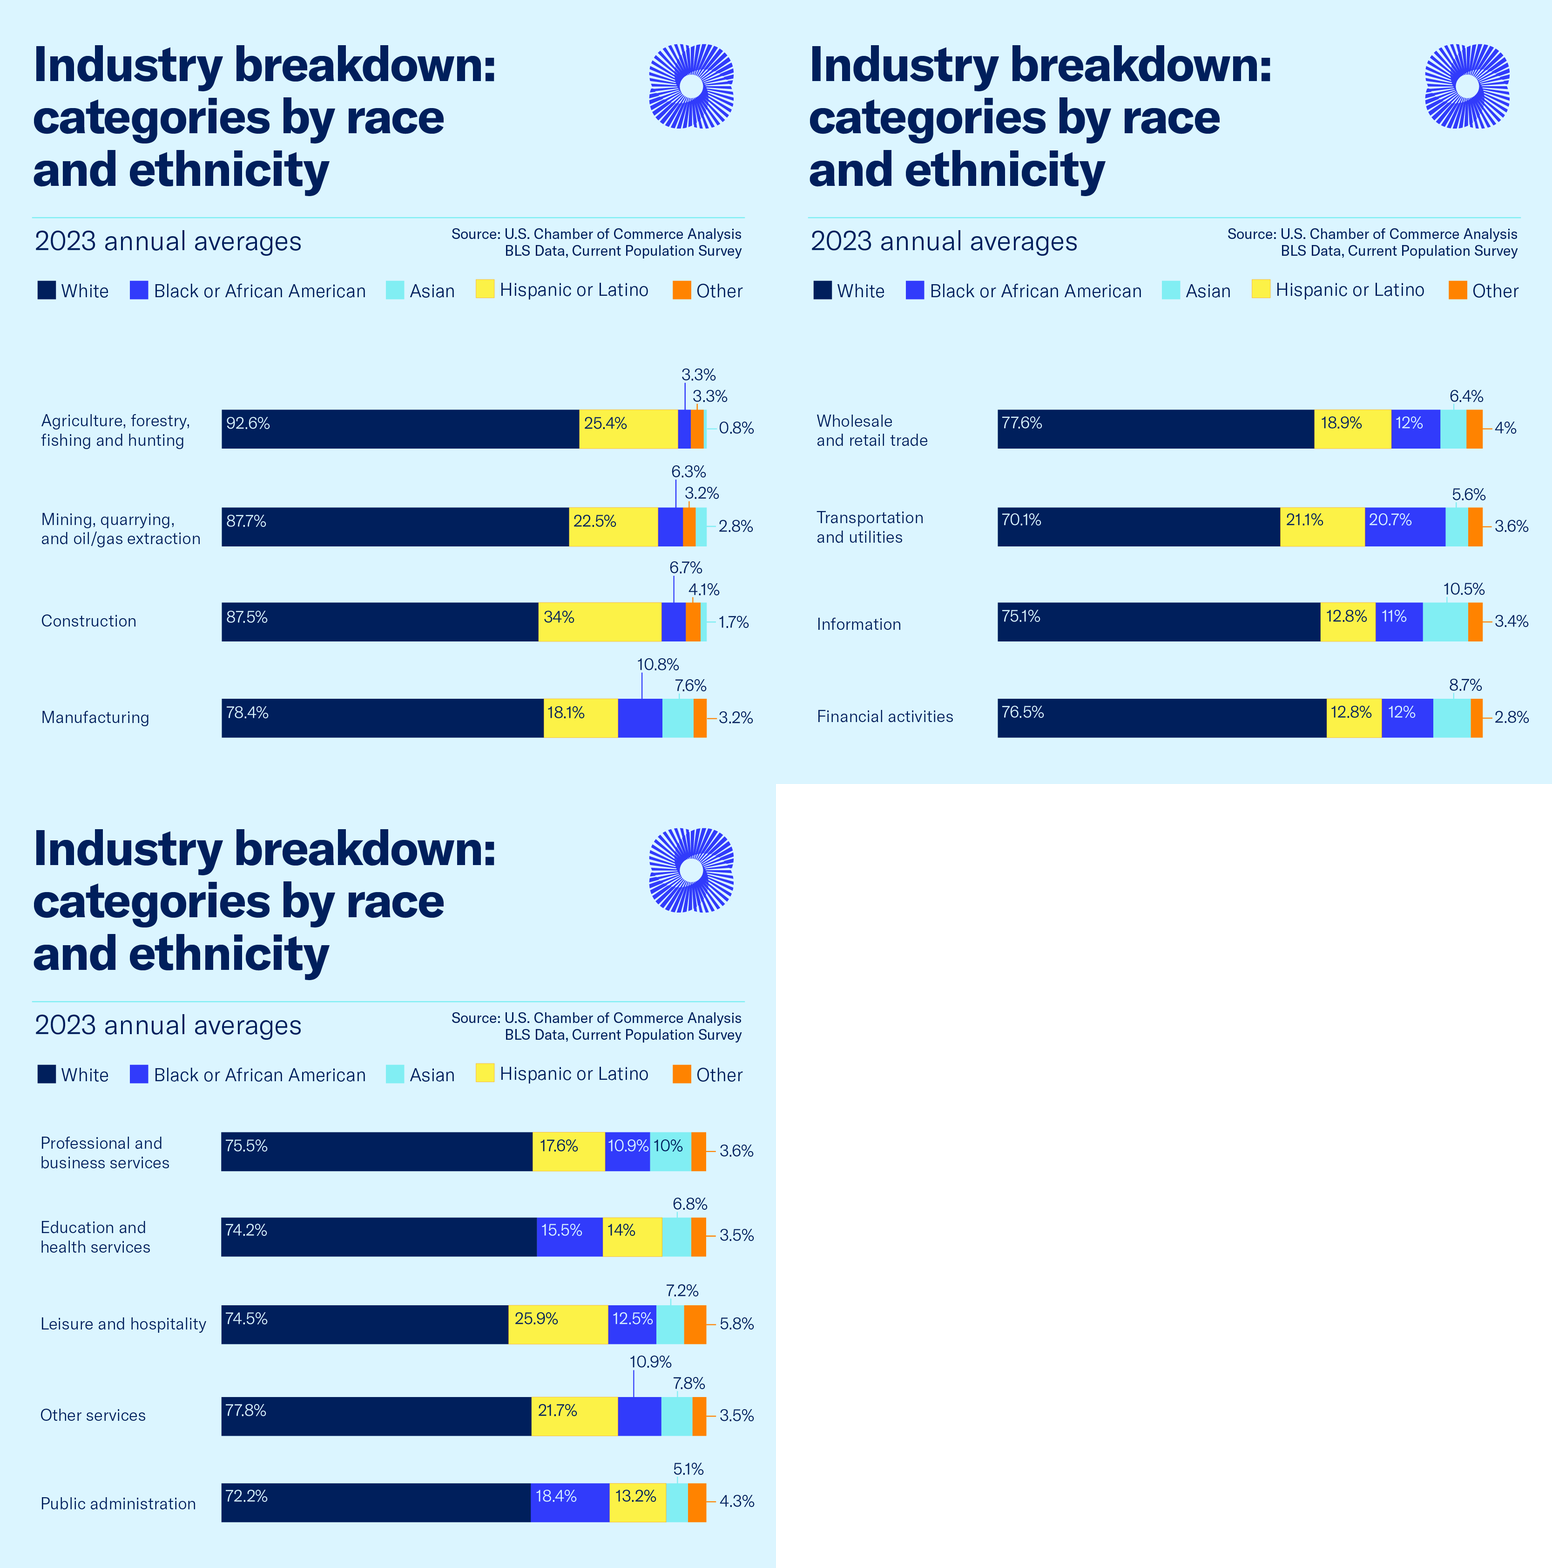
The chart above shows the percentage of Black, White, Asian individuals, and those who indicated “no, mixed, or other race,” over the age of 16 that work in the indicated industry.  

The most densely populated industries in 2021 were Education and Health Services, Wholesale and Retail Trade, and Professional and Business Services, however, the racial and ethnic make-up of these industries do not reflect the broader workforce.  

Black Americans are overrepresented in the Education and Health Services and Public Administration industries and underrepresented in Agriculture, and Mining, and Professional and Business Services industries.  

Figure 4
Figure 4

Figure 4 displays the percentage of Hispanic Americans that represent the total workforce for each industry. As shown above, Hispanic Americans are significantly overrepresented in Construction, Agriculture and Leisure and Hospitality, but underrepresented in the Education and Health Services and Information sectors. 

Conversely, Asian Americans are overrepresented in Professional & Business Services and the Information industry but greatly underrepresented in Agriculture and Construction. 

In general, occupations in the Professional and Business Services and information industries experience higher earnings than the occupations in the Construction, and Leisure and Hospitality industries. Recently, the unemployment rate in Leisure and Hospitality runs nearly twice as high than the Information and Professional and Business services industries. 

Figure 5. Source: Table 11. Employed persons by detailed occupation, sex, race, and Hispanic or Latino ethnicity. U.S. Bureau of Labor Statistics U.S. Chamber of Commerce Analysis, U.S. Bureau of Labor Statistics, Current Population Survey. Totals may not equal to 100% due to rounding.

There continues to be a strong pattern of racial disparities of employment concentrations across occupations. Black workers are, on average, more concentrated in occupations that pay less and are less likely to offer paid sick leave, health insurance, or retirement benefits. Black Americans make up roughly 12% of the workforce, but only 5.7% of the highest earners and 15.9% of the lowest earners.  

Figure 5 shows the percentage of each race that work in the indicated occupation. The most common occupation amongst working Americans in the U.S. in 2021 was Management, Professional, and Related occupations, followed by Sales and Office occupations (and then Service occupations). The most common occupation amongst working Americans in the U.S. in 2021 was Management, Professional and Related occupations, followed by Sales and Office occupations. Black Americans are overrepresented in Transport and Material Moving and Service occupations and underrepresented in Management, Professional, and Related occupations. Asian Americans are overrepresented in Professional & Related occupations and underrepresented in Construction & Extraction occupations. Conversely, Hispanic Americans are overrepresented in Construction & Extraction occupations and underrepresented in Professional & Related occupations. 

Disparities in earnings along racial and gender lines are evident across similar occupations and education levels. 

Figure 6
Figure 6

It is important to note that Hispanic/Latino falls under ethnicity whereas the other categories are races. While the definitions of ethnicity are fluid, Hispanic generally refers to individuals who identify as having a Spanish-speaking background and trace their lineage to Spanish speaking countries, and Latino typically refers to people whose origins trace back to Latin America, regardless of language. The race data does not distinguish between Hispanic and non-Hispanic. Individuals who participate in Current Population Surveys (CPS) can self-select as Hispanic or non-Hispanic ethnicity in addition to race. For example, White Hispanic individuals and White non-Hispanic individuals are grouped together in this data. The median wage data for White non-Hispanic individuals would be significantly higher if it the data were disaggregated. 

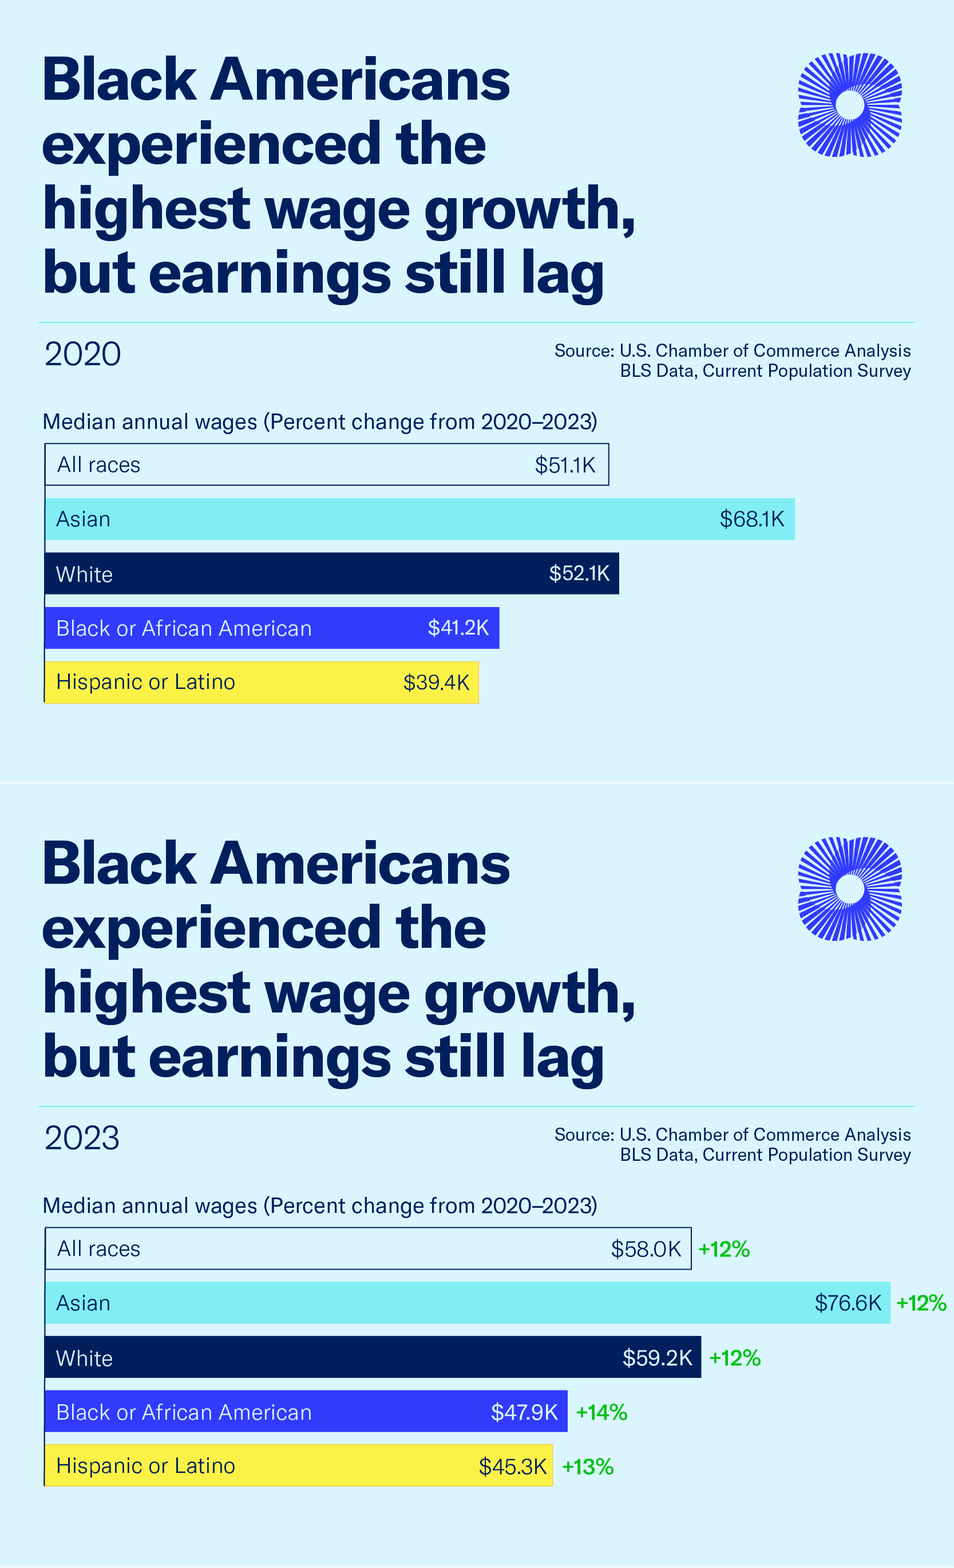
While weekly wages for Black and Hispanic workers lagged by more than $200 compared to average, in 2020, in 2022, Black American wages have increased 11% and the lag has decreased to just over $150.  

Figure 7 shows the differences in wage growth for Black Americans in different industries. 

Figure 7
Figure 7

In a 2021 report for the Department of Labor, researchers compared wage data from 1997 – 2018 for Black Americans and White Americans who entered into certain occupation categories between the ages of 18 – 34. As Figure 7 shows, Black Americans realized the greatest wage disparity in industries where they are represented the lowest, while realizing the lowest wage disparity in the industries they are represented the highest. In the Management, Finance, and Business sector, Black wage growth over the 10-year period was greater than White wage growth. 


ENTREPRENEURSHIP

Entrepreneurship can be a catalyst for economic mobility. It plays an influential role in building wealth in families, communities, and economies. According to one study, the median net worth of Black business owners is 12 times higher than Black nonbusiness owners. 

Black Americans are less likely than their White counterparts to launch new businesses. When they do, Black-owned businesses, on average, have lower revenues, hire fewer employees, and are more vulnerable to economic shocks like COVID-19. The difference can be explained by a persistent gap in access to capital. 

As Figure 7 shows, the average number of employees for Black-owned businesses are substantially lower, even as the business matures. Black-owned businesses are also more likely than others to employ Black Americans than other businesses. 

Figure 8
Figure 8

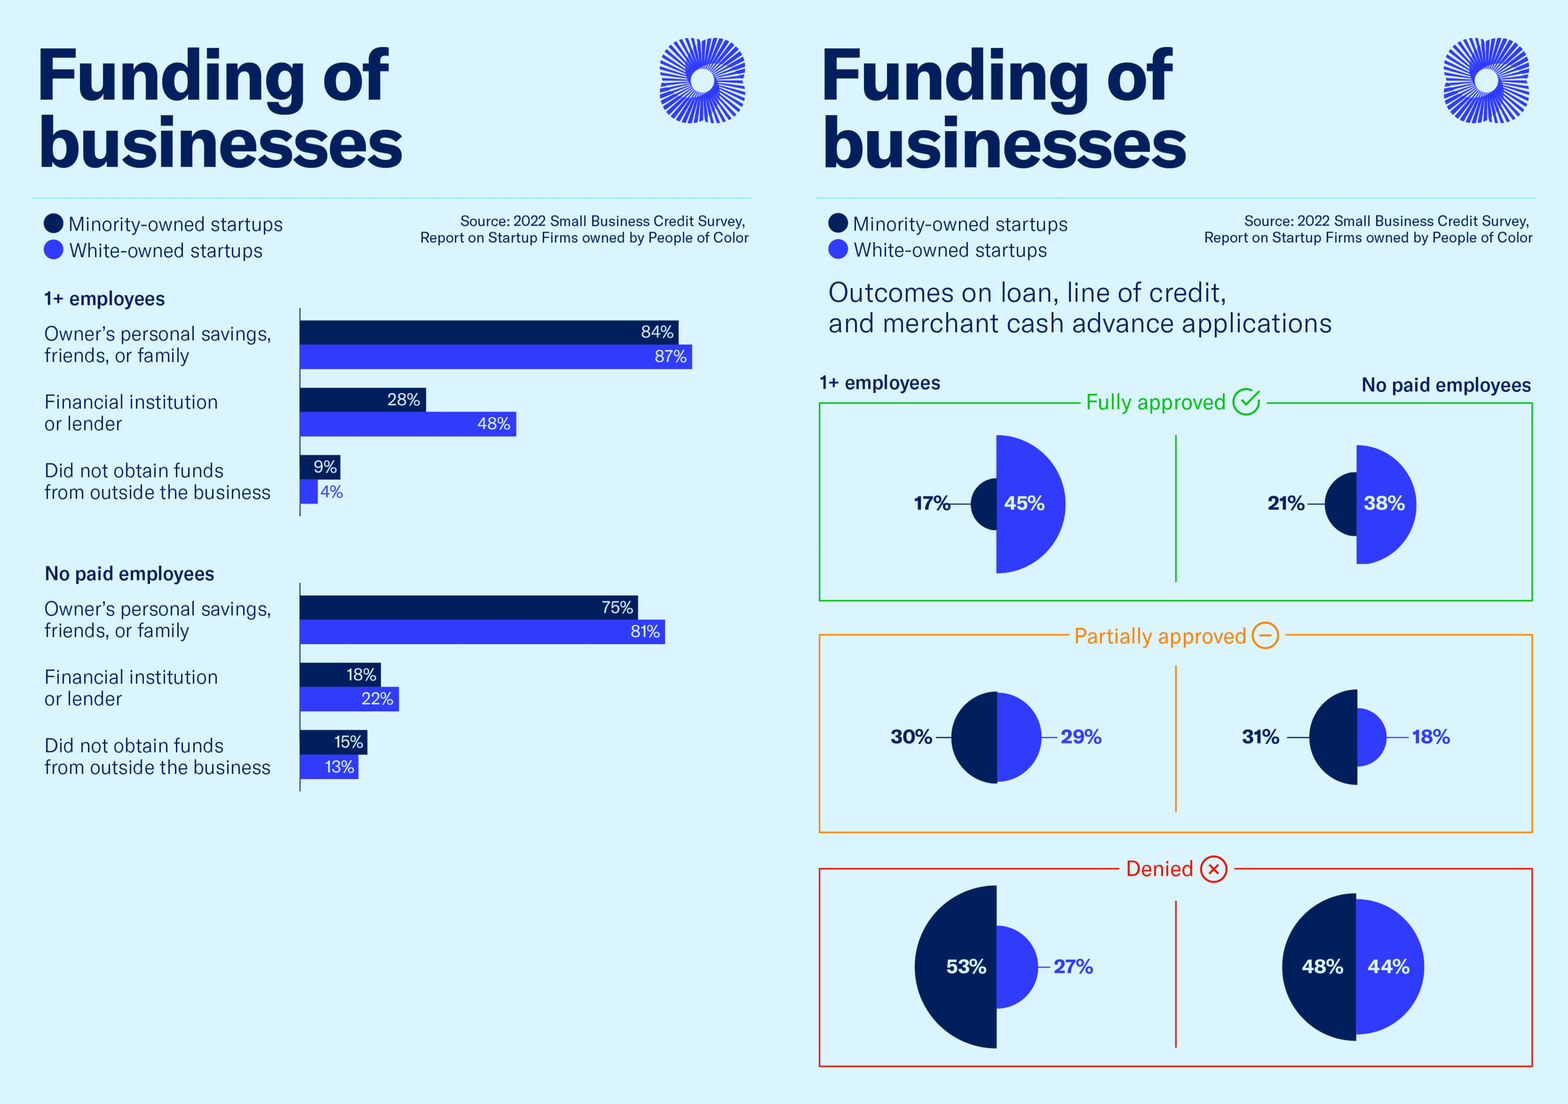
Black-owned non-employer businesses are half as likely to get financing as White-owned businesses. Black American-owned businesses have required significantly more startup money out of the owners’ pockets than White-owned businesses. 76% of Black entrepreneurs rely on personal and family savings for financing. 

The top industries for Black-owned businesses are also not the same as the top industries in the U.S. by average revenue. As Figure 9 shows, Black-owned businesses are concentrated in Healthcare and social assistance, Administrative support, waste management, and remediation, and Professional, scientific and technical industries. 

Figure 9
Figure 9

In the past few years, however, companies have made a more concerted effort to diversify their supply chains by instituting supplier diversity programs within their organizations. As Figure 10 shows, prioritizing supplier diversity has an influence on consumer sentiment. According to one survey, 82% of consumers polled said that whether an organization has a supplier diversity program influences whether or not they will buy from them. 

Figure 10
Figure 10

Figure 10 shows the breakdown of diversity spend of Fortune 500 companies, 85% of which have a dedicated supplier diversity program in place. Businesses in the Telecommunication and Healthcare industries spend the most on supplier diversity, and dollars are most concentrated in labor. 

Supplier diversity is a proven method in which large enterprises can promote smaller, minority owned business endeavors. While consumer attitudes support such business strategies, implementing supplier diversity programs also provides greater economic opportunity for minority business owners, employers, and employees. 

Figure 11
Figure 11

 Some of America’s most recognizable brands are committed to supplier diversity. Yet, hurdles in implementing and practicing a successful program still exist. Figure 12 highlights some of the typical barriers to such supplier diversity programs and common strategies to overcome these. 

Figure 12
Figure 12

CRIMINAL JUSTICE

In the United States, Black Americans are more likely than White Americans to be arrested; once they are arrested, they are more likely to be convicted; once convicted, they are more likely to experience lengthy prison sentences. 

Black Americans only make up roughly 13% of the population, but 27% of arrests (about twice their proportion of the total population) and 38% of the prison population

Black Americans are incarcerated in state prisons at 5.1 times the rate of White Americans

Although this paints a grim picture, Figure 13, below shows that overall imprisonment rates have fallen over the last decade. 

Figure 13. Source: Table 6, Imprisonment rates of U.S. adults, based on sentenced prisoners under jurisdiction of state or federal correctional authorities, by jurisdiction, sex, and race or ethnicity, 2008-2018. Prisoners in 2018, U.S. Department of Justice, Office of Justice Programs, Bureau of Justice Statistics.

 It is also harder for Black Americans to bounce back economically after incarceration. A criminal conviction limits employment prospects. A criminal record reduces employer callback rates by 65% for Black American men, compared to a 50% reduction for White men. 

Employing individuals with criminal records benefits society. Workers are more likely to achieve stability and less likely to return to prison, and businesses gain access to an often-overlooked labor pool. Giving returning citizens a second chance can also lead to reduced employee turnover. At the same time, crime is reduced while employment rates increase, directly supporting a more prosperous society. 

To learn more about Second Chance hiring, visit our Data Deep Dive: The Workforce Impact of Second Chance Hiring


HEALTH

Race is associated with several healthcare access disparities. Minority patients have markedly worse health outcomes than White patients, with Black Americans having the most significant differences. 

Figure 14 compares the U.S. life expectancy at birth by sex, race, Hispanic ethnicity. On average, Black Americans’ life expectancy is over 8 years lower than other races. It dropped dramatically between 2019 and 2020, as did other races, likely due to trends coming out of the pandemic. 

Figure 14. Source: Life expectancy at birth, by Hispanic origin and race: United States 2019 – 2021. Centers for Disease Control and Prevention.

Access to good healthcare insurance coverage helps people live longer, healthier lives

  • 15%
    Uninsured Black Americans
  • 9%
    Uninsured White Americans
  • 30%
    Publicly insured Black Americans
  • 18%
    Publicly insured White Americans

Figure 15 illustrates 2020 insurance coverage by race. Insurance coverage is relatively even across races and Hispanic ethnicity and the percentage of those uninsured has decreased over time. Black, Latino, and American Indian/Native American remain uninsured at significantly higher rates than other races.

Figure 15
Figure 15

According to the U.S. Department of Health and Human Services, only 55% of Black Americans aged 18 – 64 are covered by private health insurance compared to 73% their White counterparts. The difference is more than made up by public health insurance and, for 15% of the Black population aged 18 – 64, being uninsured.  

Black Americans and Hispanic Americans lack private health coverage by 11.7% and 17.3%, respectively. This difference is more than made up by public health insurance for Black Americans. 

Figure 16 illustrates the market share of each type of private insurance. More than half of all individuals are covered by employment-based plans. 

Figure 16. Source: U.S. Census Bureau, Current Population Survey, 2019 and 2021 Annual Social and Economic Supplement (CPS ASEC).

WEALTH DISPARITY 

Historically, Black American families have held approximately one-tenth of the wealth of White American families and 19% of Black Americans live below the poverty level, compared to 7% of White Americans. 

The mean income for Black American families is roughly a quarter less than the average all Americans. 

Figure 17 compares mean family income before tax, median family income before tax, and the number of families that were able to save by race. White families’ median income was approximately $30,000 higher than Black families’ median income. Compared to White Americans, Black Americans make $.76 on the dollar. 

Figure 17. Source: Table A-2. Households by Total Money Income, Race, and Hispanic Origin of Householder: 1967 to 2021. U.S. Census Bureau.

Figure 18 looks at trends in income by race from 2002 to 2022. On the bright side the average income across all races has gone up over the last decade, except for the dip around the COVID 19 pandemic and Black Americans experienced the least drastic loss in income compared to other races. 

Figure 18
Figure 18

Figure 19 displays the median and mean family net worth across races. Black families’ median and mean net worth was the lowest of all families in 2022. Specifically, the median net worth and average net worth of American families was nearly seven times higher than that of Black families for the same year. 

Figure 19
Figure 19

ACTIONABLE SOLUTIONS

Systemic inequalities in these six areas perpetuate broader inequalities in our society, hold back individual and business success, and hinder economic growth. 

Driven by data and informed by conversations with business, government, academic, and civic leaders, we developed the Equality of Opportunity Agenda to advance private sector solutions and best practices, scale impactful programs, and drive policy action at the federal, state, and local level. 

The Equality of Opportunity Agenda

We also will continue to identify and advance other solutions to help close the equality of opportunity gaps.

The U.S. Chamber of Commerce has made real progress in convening the business community to identify data-driven solutions to the inequalities that exist in society and is committed to continuing to put the collective muscle of American business behind advancing solutions that deliver equal opportunity to all.

Learn More

    About the authors

    Jenna Shrove

    Jenna Shrove

    Jenna Shrove is the Executive Director of Strategic Advocacy and Advisor to the Chief Policy Officer at the U.S. Chamber of Commerce.

    Read more

    Stephanie Ferguson

    Stephanie Ferguson

    Stephanie Ferguson is the Director of Global Employment Policy & Special Initiatives. Her work on the labor shortage has been cited in the Wall Street Journal, Washington Post, and Associated Press.

    Read more

    Isabella Lucy

    Isabella Lucy

    Isabella has created stunning visualizations tackling pressing issues like the worker shortage, the benefits of hiring veterans, the lifespan of small businesses, and the future of work.

    Read more