Makinizi Hoover Makinizi Hoover
Senior Manager, Strategic Advocacy, U.S. Chamber of Commerce
Stephanie Ferguson Stephanie Ferguson
Director, Global Employment Policy & Special Initiatives, U.S. Chamber of Commerce
Isabella Lucy Isabella Lucy
Graphic Designer, U.S. Chamber of Commerce

Published

October 13, 2023

Share

The state of Texas has a favorable landscape for businesses and individuals, with a diverse economy, strong labor market recovery, and a robust small business ecosystem. Immigrants contribute meaningfully to the state's workforce and economy, while educational attainment, quality of life, and cost of living factors remain promising.  

The Worker Shortage Across America

Explore the interactive map below to see the impact of the worker shortage crisis in each state.

Least severe
Severe
More severe
Most severe

Alabama

  • 0.38
    Alabama's Worker Shortage Index
  • Job Openings: 129,000
  • Unemployed Workers: 48,590
  • Labor Force Participation Rate: 57.0%
  • Unemployment Rate: 2.1%
  • Quit Rate: 2.9%
  • Hiring Rate: 4.5%

Alaska

  • 0.59
    Alaska's Worker Shortage Index
  • Job Openings: 24,000
  • Unemployed Workers: 14,081
  • Labor Force Participation Rate: 65.2%
  • Unemployment Rate: 3.9%
  • Quit Rate: 3.4%
  • Hiring Rate: 4.9%

Arizona

  • 0.71
    Arizona's Worker Shortage Index
  • Job Openings: 199,000
  • Unemployed Workers: 141,617
  • Labor Force Participation Rate: 61.8%
  • Unemployment Rate: 3.8%
  • Quit Rate: 3.0%
  • Hiring Rate: 4.0%

Arkansas

  • 0.44
    Arkansas's Worker Shortage Index
  • Job Openings: 84,000
  • Unemployed Workers: 37,339
  • Labor Force Participation Rate: 57.7%
  • Unemployment Rate: 2.7%
  • Quit Rate: 2.7%
  • Hiring Rate: 4.3%

California

  • 0.92
    California's Worker Shortage Index
  • Job Openings: 975,000
  • Unemployed Workers: 895,044
  • Labor Force Participation Rate: 62.4%
  • Unemployment Rate: 4.6%
  • Quit Rate: 1.7%
  • Hiring Rate: 3.4%

Colorado

  • 0.52
    Colorado's Worker Shortage Index
  • Job Openings: 191,000
  • Unemployed Workers: 99,856
  • Labor Force Participation Rate: 68.7%
  • Unemployment Rate: 3.1%
  • Quit Rate: 2.3%
  • Hiring Rate: 3.0%

Connecticut

  • 0.74
    Connecticut's Worker Shortage Index
  • Job Openings: 91,000
  • Unemployed Workers: 67,253
  • Labor Force Participation Rate: 64.1%
  • Unemployment Rate: 3.5%
  • Quit Rate: 2.0%
  • Hiring Rate: 3.6%

Delaware

  • 0.63
    Delaware's Worker Shortage Index
  • Job Openings: 33,000
  • Unemployed Workers: 20,812
  • Labor Force Participation Rate: 60.3%
  • Unemployment Rate: 4.1%
  • Quit Rate: 3.1%
  • Hiring Rate: 5.4%

District of Columbia

  • 0.45
    District of Columbia's Worker Shortage Index
  • Job Openings: 43,000
  • Unemployed Workers: 19,519
  • Labor Force Participation Rate: 70.9%
  • Unemployment Rate: 5.0%
  • Quit Rate: 2.1%
  • Hiring Rate: 3.4%

Florida

  • 0.53
    Florida's Worker Shortage Index
  • Job Openings: 570,000
  • Unemployed Workers: 302,949
  • Labor Force Participation Rate: 59.7%
  • Unemployment Rate: 2.7%
  • Quit Rate: 2.8%
  • Hiring Rate: 4.0%

Georgia

  • 0.54
    Georgia's Worker Shortage Index
  • Job Openings: 323,000
  • Unemployed Workers: 174,106
  • Labor Force Participation Rate: 61.4%
  • Unemployment Rate: 3.3%
  • Quit Rate: 2.9%
  • Hiring Rate: 4.8%

Hawaii

  • 0.58
    Hawaii's Worker Shortage Index
  • Job Openings: 33,000
  • Unemployed Workers: 19,024
  • Labor Force Participation Rate: 60.2%
  • Unemployment Rate: 2.8%
  • Quit Rate: 1.9%
  • Hiring Rate: 3.3%

Idaho

  • 0.53
    Idaho's Worker Shortage Index
  • Job Openings: 55,000
  • Unemployed Workers: 28,947
  • Labor Force Participation Rate: 62.4%
  • Unemployment Rate: 3.0%
  • Quit Rate: 2.9%
  • Hiring Rate: 4.5%

Illinois

  • 0.76
    Illinois's Worker Shortage Index
  • Job Openings: 349,000
  • Unemployed Workers: 266,155
  • Labor Force Participation Rate: 64.4%
  • Unemployment Rate: 4.1%
  • Quit Rate: 1.8%
  • Hiring Rate: 3.4%

Indiana

  • 0.72
    Indiana's Worker Shortage Index
  • Job Openings: 162,000
  • Unemployed Workers: 117,400
  • Labor Force Participation Rate: 63.5%
  • Unemployment Rate: 3.4%
  • Quit Rate: 2.6%
  • Hiring Rate: 4.2%

Iowa

  • 0.67
    Iowa's Worker Shortage Index
  • Job Openings: 75,000
  • Unemployed Workers: 50,242
  • Labor Force Participation Rate: 68.7%
  • Unemployment Rate: 2.9%
  • Quit Rate: 2.4%
  • Hiring Rate: 3.3%

Kansas

  • 0.51
    Kansas's Worker Shortage Index
  • Job Openings: 82,000
  • Unemployed Workers: 41,743
  • Labor Force Participation Rate: 66.7%
  • Unemployment Rate: 2.7%
  • Quit Rate: 2.1%
  • Hiring Rate: 3.9%

Kentucky

  • 0.74
    Kentucky's Worker Shortage Index
  • Job Openings: 111,000
  • Unemployed Workers: 82,001
  • Labor Force Participation Rate: 57.6%
  • Unemployment Rate: 4.0%
  • Quit Rate: 2.9%
  • Hiring Rate: 4.1%

Louisiana

  • 0.55
    Louisiana's Worker Shortage Index
  • Job Openings: 126,000
  • Unemployed Workers: 68,804
  • Labor Force Participation Rate: 59.0%
  • Unemployment Rate: 3.3%
  • Quit Rate: 3.0%
  • Hiring Rate: 5.7%

Maine

  • 0.42
    Maine's Worker Shortage Index
  • Job Openings: 41,000
  • Unemployed Workers: 17,148
  • Labor Force Participation Rate: 58.6%
  • Unemployment Rate: 2.5%
  • Quit Rate: 1.7%
  • Hiring Rate: 3.6%

Maryland

  • 0.33
    Maryland's Worker Shortage Index
  • Job Openings: 165,000
  • Unemployed Workers: 54,778
  • Labor Force Participation Rate: 65.3%
  • Unemployment Rate: 1.7%
  • Quit Rate: 2.3%
  • Hiring Rate: 4.0%

Massachusetts

  • 0.42
    Massachusetts's Worker Shortage Index
  • Job Openings: 236,000
  • Unemployed Workers: 98,262
  • Labor Force Participation Rate: 64.5%
  • Unemployment Rate: 2.6%
  • Quit Rate: 1.3%
  • Hiring Rate: 3.2%

Michigan

  • 0.85
    Michigan's Worker Shortage Index
  • Job Openings: 216,000
  • Unemployed Workers: 183,249
  • Labor Force Participation Rate: 61.3%
  • Unemployment Rate: 3.7%
  • Quit Rate: 2.1%
  • Hiring Rate: 3.7%

Minnesota

  • 0.51
    Minnesota's Worker Shortage Index
  • Job Openings: 192,000
  • Unemployed Workers: 97,053
  • Labor Force Participation Rate: 68.5%
  • Unemployment Rate: 3.1%
  • Quit Rate: 2.3%
  • Hiring Rate: 3.5%

Mississippi

  • 0.49
    Mississippi's Worker Shortage Index
  • Job Openings: 80,000
  • Unemployed Workers: 39,159
  • Labor Force Participation Rate: 54.3%
  • Unemployment Rate: 3.2%
  • Quit Rate: 3.2%
  • Hiring Rate: 4.9%

Missouri

  • 0.53
    Missouri's Worker Shortage Index
  • Job Openings: 167,000
  • Unemployed Workers: 87,977
  • Labor Force Participation Rate: 63.7%
  • Unemployment Rate: 2.8%
  • Quit Rate: 2.2%
  • Hiring Rate: 3.3%

Montana

  • 0.42
    Montana's Worker Shortage Index
  • Job Openings: 35,000
  • Unemployed Workers: 14,691
  • Labor Force Participation Rate: 62.7%
  • Unemployment Rate: 2.5%
  • Quit Rate: 3.1%
  • Hiring Rate: 4.8%

Nebraska

  • 0.39
    Nebraska's Worker Shortage Index
  • Job Openings: 54,000
  • Unemployed Workers: 21,145
  • Labor Force Participation Rate: 69.2%
  • Unemployment Rate: 2.0%
  • Quit Rate: 2.3%
  • Hiring Rate: 3.6%

Nevada

  • 0.93
    Nevada's Worker Shortage Index
  • Job Openings: 92,000
  • Unemployed Workers: 85,620
  • Labor Force Participation Rate: 61.7%
  • Unemployment Rate: 5.4%
  • Quit Rate: 2.6%
  • Hiring Rate: 4.1%

New Hampshire

  • 0.28
    New Hampshire's Worker Shortage Index
  • Job Openings: 50,000
  • Unemployed Workers: 13,782
  • Labor Force Participation Rate: 64.6%
  • Unemployment Rate: 1.8%
  • Quit Rate: 2.1%
  • Hiring Rate: 4.2%

New Jersey

  • 0.84
    New Jersey's Worker Shortage Index
  • Job Openings: 243,000
  • Unemployed Workers: 203,340
  • Labor Force Participation Rate: 65.5%
  • Unemployment Rate: 4.2%
  • Quit Rate: 2.1%
  • Hiring Rate: 3.4%

New Mexico

  • 0.55
    New Mexico's Worker Shortage Index
  • Job Openings: 65,000
  • Unemployed Workers: 35,840
  • Labor Force Participation Rate: 57.2%
  • Unemployment Rate: 3.7%
  • Quit Rate: 2.4%
  • Hiring Rate: 4.5%

New York

  • 0.87
    New York's Worker Shortage Index
  • Job Openings: 441,000
  • Unemployed Workers: 384,655
  • Labor Force Participation Rate: 61.5%
  • Unemployment Rate: 3.9%
  • Quit Rate: 1.4%
  • Hiring Rate: 3.0%

North Carolina

  • 0.55
    North Carolina's Worker Shortage Index
  • Job Openings: 316,000
  • Unemployed Workers: 173,531
  • Labor Force Participation Rate: 60.8%
  • Unemployment Rate: 3.3%
  • Quit Rate: 2.7%
  • Hiring Rate: 3.7%

North Dakota

  • 0.30
    North Dakota's Worker Shortage Index
  • Job Openings: 26,000
  • Unemployed Workers: 7,890
  • Labor Force Participation Rate: 69.5%
  • Unemployment Rate: 1.9%
  • Quit Rate: 2.5%
  • Hiring Rate: 3.9%

Ohio

  • 0.62
    Ohio's Worker Shortage Index
  • Job Openings: 314,000
  • Unemployed Workers: 195,642
  • Labor Force Participation Rate: 62.1%
  • Unemployment Rate: 3.4%
  • Quit Rate: 2.4%
  • Hiring Rate: 3.4%

Oklahoma

  • 0.52
    Oklahoma's Worker Shortage Index
  • Job Openings: 104,000
  • Unemployed Workers: 54,368
  • Labor Force Participation Rate: 61.8%
  • Unemployment Rate: 2.8%
  • Quit Rate: 2.9%
  • Hiring Rate: 4.9%

Oregon

  • 0.66
    Oregon's Worker Shortage Index
  • Job Openings: 111,000
  • Unemployed Workers: 73,506
  • Labor Force Participation Rate: 61.7%
  • Unemployment Rate: 3.4%
  • Quit Rate: 2.3%
  • Hiring Rate: 3.5%

Pennsylvania

  • 0.66
    Pennsylvania's Worker Shortage Index
  • Job Openings: 342,000
  • Unemployed Workers: 226,208
  • Labor Force Participation Rate: 61.9%
  • Unemployment Rate: 3.5%
  • Quit Rate: 2.0%
  • Hiring Rate: 2.9%

Rhode Island

  • 0.53
    Rhode Island's Worker Shortage Index
  • Job Openings: 29,000
  • Unemployed Workers: 15,232
  • Labor Force Participation Rate: 63.3%
  • Unemployment Rate: 2.7%
  • Quit Rate: 1.8%
  • Hiring Rate: 3.9%

South Carolina

  • 0.43
    South Carolina's Worker Shortage Index
  • Job Openings: 168,000
  • Unemployed Workers: 73,016
  • Labor Force Participation Rate: 57.0%
  • Unemployment Rate: 3.0%
  • Quit Rate: 3.0%
  • Hiring Rate: 4.3%

South Dakota

  • 0.36
    South Dakota's Worker Shortage Index
  • Job Openings: 25,000
  • Unemployed Workers: 9,073
  • Labor Force Participation Rate: 67.8%
  • Unemployment Rate: 1.9%
  • Quit Rate: 2.6%
  • Hiring Rate: 3.9%

Tennessee

  • 0.56
    Tennessee's Worker Shortage Index
  • Job Openings: 189,000
  • Unemployed Workers: 105,102
  • Labor Force Participation Rate: 59.4%
  • Unemployment Rate: 3.1%
  • Quit Rate: 2.9%
  • Hiring Rate: 4.8%

Texas

  • 0.80
    Texas's Worker Shortage Index
  • Job Openings: 774,000
  • Unemployed Workers: 622,845
  • Labor Force Participation Rate: 64.2%
  • Unemployment Rate: 4.1%
  • Quit Rate: 2.7%
  • Hiring Rate: 3.8%

Utah

  • 0.44
    Utah's Worker Shortage Index
  • Job Openings: 105,000
  • Unemployed Workers: 45,772
  • Labor Force Participation Rate: 69.8%
  • Unemployment Rate: 2.5%
  • Quit Rate: 2.8%
  • Hiring Rate: 3.7%

Vermont

  • 0.36
    Vermont's Worker Shortage Index
  • Job Openings: 18,000
  • Unemployed Workers: 6,407
  • Labor Force Participation Rate: 64.0%
  • Unemployment Rate: 1.8%
  • Quit Rate: 2.3%
  • Hiring Rate: 3.6%

Virginia

  • 0.47
    Virginia's Worker Shortage Index
  • Job Openings: 243,000
  • Unemployed Workers: 113,102
  • Labor Force Participation Rate: 66.7%
  • Unemployment Rate: 2.5%
  • Quit Rate: 2.6%
  • Hiring Rate: 4.3%

Washington

  • 0.77
    Washington's Worker Shortage Index
  • Job Openings: 189,000
  • Unemployed Workers: 145,895
  • Labor Force Participation Rate: 64.6%
  • Unemployment Rate: 3.6%
  • Quit Rate: 2.2%
  • Hiring Rate: 3.4%

West Virginia

  • 0.54
    West Virginia's Worker Shortage Index
  • Job Openings: 52,000
  • Unemployed Workers: 28,256
  • Labor Force Participation Rate: 54.9%
  • Unemployment Rate: 3.6%
  • Quit Rate: 3.3%
  • Hiring Rate: 5.1%

Wisconsin

  • 0.54
    Wisconsin's Worker Shortage Index
  • Job Openings: 165,000
  • Unemployed Workers: 89,517
  • Labor Force Participation Rate: 65.7%
  • Unemployment Rate: 2.9%
  • Quit Rate: 2.3%
  • Hiring Rate: 3.3%

Wyoming

  • 0.46
    Wyoming's Worker Shortage Index
  • Job Openings: 19,000
  • Unemployed Workers: 8,739
  • Labor Force Participation Rate: 64.5%
  • Unemployment Rate: 2.9%
  • Quit Rate: 3.1%
  • Hiring Rate: 4.5%

The Chamber’s Worker Shortage Index ratio indicates the number of available workers for every job opening. A ratio above 1.0 indicates a surplus of available workers compared to job openings.  

Texas’s Labor Market  

Before the pandemic, Texas’s labor market was healthy. The state had nearly enough workers to fill every open job. The quit rate was 2.7% and the hiring rate was 4.2%. The state's unemployment rate mirrored the national average, standing at 3.5%, while its labor force participation rate of 63.8% was similarly in line with the national average. 

As of August 2023, Texas's labor market was consistently showing signs of improvement. The state's labor force participation rate is slightly higher than it was before the pandemic.

On the downside, the unemployment rate is still higher than February 2020. The state is also grappling with a workforce shortage, evident by the fact that there are only 80 available workers for every 100 open job positions.

Texas’s Business Environment  

Ranked as the 9th largest economy in the world, Texas stands as a business powerhouse, featuring a robust and diverse agricultural sector, numerous professional sports teams, several prominent universities, and the headquarters of numerous Fortune 500 companies.    

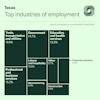
Among the industries monitored by the Bureau of Labor Statistics, the trade, transportation, and utilities sector, as well as the professional and business services sector, employ the highest number of Texans, while the construction sector employs the fewest. The prominent industries of employment in Texas are linked to the state's substantial impact on the global economy, resulting in a high demand for trade and transportation services and a healthy business landscape. 

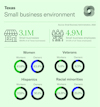
Texas features a thriving small business ecosystem, encompassing 99.8% of all businesses in the state. Nearly 45% of Texas's workforce is employed by small businesses. In this significant landscape, 43.4% of small businesses are women-owned, 21% are minority-owned, 30% are owned by Hispanics, and 6.5% are veteran-owned.  

Texas’s Educational Attainment  

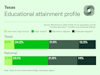
Around 86% of the Texas population has achieved at least a high school diploma or its equivalent, slightly below the 2022 national average. One-third of the population has earned at least a bachelor's degree, while 12.3% have completed a graduate degree, also slightly below the U.S. average.

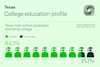
Fortunately for employers in the state, the vast majority (84.3%) of Texas college freshmen are remaining in the state for their higher education, where the average in-state tuition is $8,598.  

Out-of-state tuition in the Lone Star state is $24,889, slightly less expensive than the national average out-of-state tuition of $28,000. Over 1.6 million students are enrolled in a Texas college for the 2022-2023 school year. This large talent pool presents a valuable opportunity for local employers to recruit top-notch talent. 

Quality of Life  

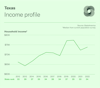
Texas's median household income of $74,640 is slightly higher than the national average of around $70,000, ranking the state 24th among all states. Notably, Texas is among the few states that do not impose an income tax. 

A third of Texas’s workforce work remote at least one day a week. For those who commute to an office, the average commute time is 26.6 minutes. Texas's cost of living index, as measured by the Council for Community and Economic Research (with the national average set at 100), stands at 93. This means that the state is notably more affordable compared to the national cost of living. The median rent is $1,082, while the median home cost is $305,497, both falling beneath the national average. In 2021, 62.4% of the population owned their housing unit, and the state experienced a growth rate of 2.73% from 2020 to 2022.   

Immigration  

In the U.S., immigrants tend to be of working age in comparison to native-born individuals. As workers, these immigrants are also contributing to support programs like Medicare and social security.  

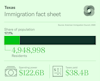
Looking at Texas in particular, immigrants comprise a significant part (17.1%) of the state's population, totaling nearly five million individuals. Their collective spending power amounts to $122.6 billion, while their tax contributions reach $38.4 billion.  

Related

    About the authors

    Makinizi Hoover

    Makinizi Hoover

    Makinizi Hoover is the Senior Manager of Strategic Advocacy at the U.S. Chamber of Commerce. Her work includes the development and project management of comprehensive data centers that serve as a valuable resource for policymakers, businesses, and the public.

    Read more

    Stephanie Ferguson

    Stephanie Ferguson

    Stephanie Ferguson is the Director of Global Employment Policy & Special Initiatives. Her work on the labor shortage has been cited in the Wall Street Journal, Washington Post, and Associated Press.

    Read more

    Isabella Lucy

    Isabella Lucy

    Isabella has created stunning visualizations tackling pressing issues like the worker shortage, the benefits of hiring veterans, the lifespan of small businesses, and the future of work.

    Read more