Stephanie Ferguson Melhorn
Executive Director, Workforce & International Labor Policy, U.S. Chamber of Commerce
Updated
May 06, 2026
Published
January 09, 2024
This page captures the latest data around job openings, labor force participation, shortages by state and industry, the skills gap, and more, for a quick understanding of the state of the workforce. For more workforce content, programs, and solutions from the U.S. Chamber and U.S. Chamber of Commerce Foundation, visit the America Works Initiative.
The Workforce Returns, Downward Participation Persists
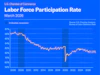
The labor force participation rate has trended downward for more than 20 years. In 2000, the labor force participation rate hovered around 66%. Since 2021, the labor force participation rate has stayed mainly between 62 – 63%. While the participation rate is climbing back upward, it took a hit during the pandemic as early retirements, childcare challenges, and less immigration left the nation with a severe worker deficit.
Plus, boosted unemployment benefits, stimulus payments, and child tax credits offered during the pandemic padded finances and the period saw some previously employed people choosing to opt out of the workforce. However, persistent inflation is cutting into savings accounts Americans built-up over the pandemic, pushing workers to return to the workforce.
Recent reports from the Bureau of Labor Statistics (BLS) show that thousands of people are entering the workforce. In August 2024, the labor force participation rate for those between the ages of 25 and 54 (prime working age) was 83.9%, marking a twenty-year high.

Over the last few years, the gap between job openings and unemployed workers has narrowed, but the labor market remains competitive. Up until April 2025, the U.S. remained in a worker shortage: There were more open jobs than available workers. meaning that if every unemployed person in the country found a job, we would still have open jobs. That is still the case in many states and industries, but nationally the gap has largely closed.
A tight labor market can hinder economic growth. If businesses can’t hire the workers they need, they cannot grow or reach full productivity potential.
The Workforce State-by-State
The Chamber’s Worker Shortage Index number indicates the number of available workers for every job opening using data from BLS. A state with a ratio below 1 is in a worker shortage, while a ratio higher than 1 means the state has more workers than job openings—a labor surplus.
The Worker Shortage Across America
Explore the interactive map below to see the impact of the worker shortage crisis in each state.
Alabama
Alabama has 61 available workers for every 100 open jobs.
Last updated December 2025
-
0.61
Alabama's Worker Shortage Index
- Job Openings: 106,000
- Unemployed Workers: 64,150
- Labor Force Participation Rate: 57.7
- Unemployment Rate: 2.7
- Quit Rate: 2.2
- Hiring Rate: 2.8
Alaska
Alaska has 98 available workers for every 100 open jobs.
Last updated December 2025
-
0.98
Alaska's Worker Shortage Index
- Job Openings: 18,000
- Unemployed Workers: 17,656
- Labor Force Participation Rate: 65.8
- Unemployment Rate: 4.8
- Quit Rate: 2.7
- Hiring Rate: 5.6
Arizona
Arizona has 118 available workers for every 100 open jobs.
Last updated December 2025
-
1.18
Arizona's Worker Shortage Index
- Job Openings: 142,000
- Unemployed Workers: 167,230
- Labor Force Participation Rate: 61.9
- Unemployment Rate: 4.3
- Quit Rate: 2.1
- Hiring Rate: 3.7
Arkansas
Arkansas has 85 available workers for every 100 open jobs.
Last updated December 2025
-
0.85
Arkansas's Worker Shortage Index
- Job Openings: 72,000
- Unemployed Workers: 60,987
- Labor Force Participation Rate: 59.0
- Unemployment Rate: 4.2
- Quit Rate: 2.1
- Hiring Rate: 3.2
California
California has 163 available workers for every 100 open jobs.
Last updated December 2025
-
1.63
California's Worker Shortage Index
- Job Openings: 674,000
- Unemployed Workers: 1,096,058
- Labor Force Participation Rate: 62.6
- Unemployment Rate: 5.5
- Quit Rate: 1.4
- Hiring Rate: 2.9
Colorado
Colorado has 109 available workers for every 100 open jobs.
Last updated December 2025
-
1.09
Colorado's Worker Shortage Index
- Job Openings: 114,000
- Unemployed Workers: 123,798
- Labor Force Participation Rate: 66.9
- Unemployment Rate: 3.8
- Quit Rate: 2.2
- Hiring Rate: 3.4
Connecticut
Connecticut has 109 available workers for every 100 open jobs.
Last updated December 2025
-
1.09
Connecticut's Worker Shortage Index
- Job Openings: 74,000
- Unemployed Workers: 80,351
- Labor Force Participation Rate: 64.0
- Unemployment Rate: 4.2
- Quit Rate: 1.7
- Hiring Rate: 3.1
Delaware
Delaware has 111 available workers for every 100 open jobs.
Last updated December 2025
-
1.11
Delaware's Worker Shortage Index
- Job Openings: 24,000
- Unemployed Workers: 26,621
- Labor Force Participation Rate: 59.4
- Unemployment Rate: 5.2
- Quit Rate: 2.2
- Hiring Rate: 3.0
District of Columbia
District of Columbia has 100 available workers for every 100 open jobs.
Last updated December 2025
-
1.00
District of Columbia's Worker Shortage Index
- Job Openings: 28,000
- Unemployed Workers: 27,866
- Labor Force Participation Rate: 71.0
- Unemployment Rate: 6.7
- Quit Rate: 1.8
- Hiring Rate: 1.8
Florida
Florida has 113 available workers for every 100 open jobs.
Last updated December 2025
-
1.13
Florida's Worker Shortage Index
- Job Openings: 431,000
- Unemployed Workers: 486,118
- Labor Force Participation Rate: 57.5
- Unemployment Rate: 4.3
- Quit Rate: 2.0
- Hiring Rate: 3.0
Georgia
Georgia has 65 available workers for every 100 open jobs.
Last updated December 2025
-
0.65
Georgia's Worker Shortage Index
- Job Openings: 296,000
- Unemployed Workers: 192,721
- Labor Force Participation Rate: 60.7
- Unemployment Rate: 3.6
- Quit Rate: 2.5
- Hiring Rate: 2.8
- Top Employer Industry: Trade, Transportation, and Utilities
Hawaii
Hawaii has 76 available workers for every 100 open jobs.
Last updated December 2025
-
0.76
Hawaii's Worker Shortage Index
- Job Openings: 20,000
- Unemployed Workers: 15,188
- Labor Force Participation Rate: 60.5
- Unemployment Rate: 2.2
- Quit Rate: 2.0
- Hiring Rate: 3.2
Idaho
Idaho has 97 available workers for every 100 open jobs.
Last updated December 2025
-
0.97
Idaho's Worker Shortage Index
- Job Openings: 38,000
- Unemployed Workers: 36,883
- Labor Force Participation Rate: 62.9
- Unemployment Rate: 3.6
- Quit Rate: 2.3
- Hiring Rate: 4.1
Illinois
Illinois has 124 available workers for every 100 open jobs.
Last updated December 2025
-
1.24
Illinois's Worker Shortage Index
- Job Openings: 244,000
- Unemployed Workers: 301,823
- Labor Force Participation Rate: 63.8
- Unemployment Rate: 4.6
- Quit Rate: 1.9
- Hiring Rate: 3.6
Indiana
Indiana has 79 available workers for every 100 open jobs.
Last updated December 2025
-
0.79
Indiana's Worker Shortage Index
- Job Openings: 156,000
- Unemployed Workers: 123,873
- Labor Force Participation Rate: 63.6
- Unemployment Rate: 3.5
- Quit Rate: 2.6
- Hiring Rate: 4.0
- Top Employer Industry: Trade, Transportation, and Utilities
Iowa
Iowa has 92 available workers for every 100 open jobs.
Last updated December 2025
-
0.92
Iowa's Worker Shortage Index
- Job Openings: 67,000
- Unemployed Workers: 61,376
- Labor Force Participation Rate: 67.7
- Unemployment Rate: 3.5
- Quit Rate: 2.2
- Hiring Rate: 3.2
Kansas
Kansas has 85 available workers for every 100 open jobs.
Last updated December 2025
-
0.85
Kansas's Worker Shortage Index
- Job Openings: 70,000
- Unemployed Workers: 59,742
- Labor Force Participation Rate: 67.5
- Unemployment Rate: 3.8
- Quit Rate: 2.3
- Hiring Rate: 3.3
Kentucky
Kentucky has 94 available workers for every 100 open jobs.
Last updated December 2025
-
0.94
Kentucky's Worker Shortage Index
- Job Openings: 101,000
- Unemployed Workers: 95,327
- Labor Force Participation Rate: 58.1
- Unemployment Rate: 4.5
- Quit Rate: 2.1
- Hiring Rate: 2.8
Louisiana
Louisiana has 80 available workers for every 100 open jobs.
Last updated December 2025
-
0.80
Louisiana's Worker Shortage Index
- Job Openings: 111,000
- Unemployed Workers: 88,396
- Labor Force Participation Rate: 58.3
- Unemployment Rate: 4.2
- Quit Rate: 2.5
- Hiring Rate: 3.5
Maine
Maine has 67 available workers for every 100 open jobs.
Last updated December 2025
-
0.67
Maine's Worker Shortage Index
- Job Openings: 34,000
- Unemployed Workers: 22,672
- Labor Force Participation Rate: 59.7
- Unemployment Rate: 3.2
- Quit Rate: 1.5
- Hiring Rate: 4.1
Maryland
Maryland has 105 available workers for every 100 open jobs.
Last updated December 2025
-
1.05
Maryland's Worker Shortage Index
- Job Openings: 130,000
- Unemployed Workers: 136,376
- Labor Force Participation Rate: 64.5
- Unemployment Rate: 4.2
- Quit Rate: 2.0
- Hiring Rate: 2.5
Massachusetts
Massachusetts has 130 available workers for every 100 open jobs.
Last updated December 2025
-
1.30
Massachusetts's Worker Shortage Index
- Job Openings: 145,000
- Unemployed Workers: 188,782
- Labor Force Participation Rate: 66.5
- Unemployment Rate: 4.8
- Quit Rate: 1.6
- Hiring Rate: 2.9
Michigan
Michigan has 115 available workers for every 100 open jobs.
Last updated December 2025
-
1.15
Michigan's Worker Shortage Index
- Job Openings: 219,000
- Unemployed Workers: 252,045
- Labor Force Participation Rate: 61.0
- Unemployment Rate: 5.0
- Quit Rate: 2.5
- Hiring Rate: 3.8
Minnesota
Minnesota has 83 available workers for every 100 open jobs.
Last updated December 2025
-
0.83
Minnesota's Worker Shortage Index
- Job Openings: 158,000
- Unemployed Workers: 131,525
- Labor Force Participation Rate: 68.2
- Unemployment Rate: 4.1
- Quit Rate: 1.8
- Hiring Rate: 2.9
- Top Employer Industry: Education and Health Services
Mississippi
Mississippi has 68 available workers for every 100 open jobs.
Last updated December 2025
-
0.68
Mississippi's Worker Shortage Index
- Job Openings: 71,000
- Unemployed Workers: 48,082
- Labor Force Participation Rate: 55.6
- Unemployment Rate: 3.7
- Quit Rate: 2.5
- Hiring Rate: 3.4
- Top Employer Industry: Trade, Transportation, and Utilities
Missouri
Missouri has 87 available workers for every 100 open jobs.
Last updated December 2025
-
0.87
Missouri's Worker Shortage Index
- Job Openings: 146,000
- Unemployed Workers: 126,420
- Labor Force Participation Rate: 64.0
- Unemployment Rate: 3.9
- Quit Rate: 2.6
- Hiring Rate: 3.3
- Top Employer Industry: Trade, Transportation, and Utilities
Montana
Montana has 75 available workers for every 100 open jobs.
Last updated December 2025
-
0.75
Montana's Worker Shortage Index
- Job Openings: 26,000
- Unemployed Workers: 19,486
- Labor Force Participation Rate: 62.4
- Unemployment Rate: 3.4
- Quit Rate: 2.6
- Hiring Rate: 5.1
Nebraska
Nebraska has 75 available workers for every 100 open jobs.
Last updated December 2025
-
0.75
Nebraska's Worker Shortage Index
- Job Openings: 44,000
- Unemployed Workers: 33,085
- Labor Force Participation Rate: 69.9
- Unemployment Rate: 3.0
- Quit Rate: 2.1
- Hiring Rate: 3.0
Nevada
Nevada has 150 available workers for every 100 open jobs.
Last updated December 2025
-
1.50
Nevada's Worker Shortage Index
- Job Openings: 59,000
- Unemployed Workers: 88,569
- Labor Force Participation Rate: 63.2
- Unemployment Rate: 5.2
- Quit Rate: 2.0
- Hiring Rate: 3.6
New Hampshire
New Hampshire has 68 available workers for every 100 open jobs.
Last updated December 2025
-
0.68
New Hampshire's Worker Shortage Index
- Job Openings: 35,000
- Unemployed Workers: 23,965
- Labor Force Participation Rate: 65.3
- Unemployment Rate: 3.1
- Quit Rate: 1.8
- Hiring Rate: 4.1
- Top Employer Industry: Trade, Transportation, and Utilities
New Jersey
New Jersey has 123 available workers for every 100 open jobs.
Last updated December 2025
-
1.23
New Jersey's Worker Shortage Index
- Job Openings: 216,000
- Unemployed Workers: 264,686
- Labor Force Participation Rate: 63.7
- Unemployment Rate: 5.4
- Quit Rate: 1.5
- Hiring Rate: 3.2
New Mexico
New Mexico has 97 available workers for every 100 open jobs.
Last updated December 2025
-
0.97
New Mexico's Worker Shortage Index
- Job Openings: 44,000
- Unemployed Workers: 42,663
- Labor Force Participation Rate: 57.6
- Unemployment Rate: 4.3
- Quit Rate: 1.9
- Hiring Rate: 4.2
New York
New York has 100 available workers for every 100 open jobs.
Last updated December 2025
-
1.00
New York's Worker Shortage Index
- Job Openings: 456,000
- Unemployed Workers: 457,838
- Labor Force Participation Rate: 61.5
- Unemployment Rate: 4.6
- Quit Rate: 1.6
- Hiring Rate: 3.6
North Carolina
North Carolina has 76 available workers for every 100 open jobs.
Last updated December 2025
-
0.76
North Carolina's Worker Shortage Index
- Job Openings: 268,000
- Unemployed Workers: 204,751
- Labor Force Participation Rate: 59.2
- Unemployment Rate: 3.9
- Quit Rate: 2.4
- Hiring Rate: 3.3
North Dakota
North Dakota has 47 available workers for every 100 open jobs.
Last updated December 2025
-
0.47
North Dakota's Worker Shortage Index
- Job Openings: 24,000
- Unemployed Workers: 11,382
- Labor Force Participation Rate: 69.6
- Unemployment Rate: 2.6
- Quit Rate: 2.2
- Hiring Rate: 4.0
Ohio
Ohio has 102 available workers for every 100 open jobs.
Last updated December 2025
-
1.02
Ohio's Worker Shortage Index
- Job Openings: 260,000
- Unemployed Workers: 264,505
- Labor Force Participation Rate: 62.3
- Unemployment Rate: 4.5
- Quit Rate: 2.3
- Hiring Rate: 3.1
Oklahoma
Oklahoma has 66 available workers for every 100 open jobs.
Last updated December 2025
-
0.66
Oklahoma's Worker Shortage Index
- Job Openings: 111,000
- Unemployed Workers: 73,425
- Labor Force Participation Rate: 63.0
- Unemployment Rate: 3.6
- Quit Rate: 2.1
- Hiring Rate: 2.9
Oregon
Oregon has 158 available workers for every 100 open jobs.
Last updated December 2025
-
1.58
Oregon's Worker Shortage Index
- Job Openings: 74,000
- Unemployed Workers: 116,797
- Labor Force Participation Rate: 63.2
- Unemployment Rate: 5.2
- Quit Rate: 2.0
- Hiring Rate: 3.5
Pennsylvania
Pennsylvania has 120 available workers for every 100 open jobs.
Last updated December 2025
-
1.20
Pennsylvania's Worker Shortage Index
- Job Openings: 231,000
- Unemployed Workers: 277,617
- Labor Force Participation Rate: 61.6
- Unemployment Rate: 4.2
- Quit Rate: 1.7
- Hiring Rate: 2.6
Rhode Island
Rhode Island has 85 available workers for every 100 open jobs.
Last updated December 2025
-
0.85
Rhode Island's Worker Shortage Index
- Job Openings: 30,000
- Unemployed Workers: 25,568
- Labor Force Participation Rate: 63.8
- Unemployment Rate: 4.3
- Quit Rate: 1.9
- Hiring Rate: 4.7
South Carolina
South Carolina has 100 available workers for every 100 open jobs.
Last updated December 2025
-
1.00
South Carolina's Worker Shortage Index
- Job Openings: 125,000
- Unemployed Workers: 124,807
- Labor Force Participation Rate: 58.1
- Unemployment Rate: 4.8
- Quit Rate: 2.5
- Hiring Rate: 3.4
South Dakota
South Dakota has 46 available workers for every 100 open jobs.
Last updated December 2025
-
0.46
South Dakota's Worker Shortage Index
- Job Openings: 23,000
- Unemployed Workers: 10,596
- Labor Force Participation Rate: 68.3
- Unemployment Rate: 2.2
- Quit Rate: 2.1
- Hiring Rate: 3.8
Tennessee
Tennessee has 78 available workers for every 100 open jobs.
Last updated December 2025
-
0.78
Tennessee's Worker Shortage Index
- Job Openings: 162,000
- Unemployed Workers: 125,705
- Labor Force Participation Rate: 60.4
- Unemployment Rate: 3.6
- Quit Rate: 2.7
- Hiring Rate: 3.2
Texas
Texas has 104 available workers for every 100 open jobs.
Last updated December 2025
-
1.04
Texas's Worker Shortage Index
- Job Openings: 652,000
- Unemployed Workers: 680,422
- Labor Force Participation Rate: 64.7
- Unemployment Rate: 4.3
- Quit Rate: 1.9
- Hiring Rate: 3.1
Utah
Utah has 96 available workers for every 100 open jobs.
Last updated December 2025
-
0.96
Utah's Worker Shortage Index
- Job Openings: 70,000
- Unemployed Workers: 67,256
- Labor Force Participation Rate: 67.6
- Unemployment Rate: 3.6
- Quit Rate: 2.1
- Hiring Rate: 3.5
- Top Employer Industry: Trade, Transportation, and Utilities
Vermont
Vermont has 53 available workers for every 100 open jobs.
Last updated December 2025
-
0.53
Vermont's Worker Shortage Index
- Job Openings: 17,000
- Unemployed Workers: 9,019
- Labor Force Participation Rate: 64.0
- Unemployment Rate: 2.6
- Quit Rate: 1.9
- Hiring Rate: 3.8
- Top Employer Industry: Education and Health Services
Virginia
Virginia has 76 available workers for every 100 open jobs.
Last updated December 2025
-
0.76
Virginia's Worker Shortage Index
- Job Openings: 216,000
- Unemployed Workers: 163,222
- Labor Force Participation Rate: 64.3
- Unemployment Rate: 3.6
- Quit Rate: 2.2
- Hiring Rate: 3.3
- Top Employer Industry: Professional and Business Services
Washington
Washington has 158 available workers for every 100 open jobs.
Last updated December 2025
-
1.58
Washington's Worker Shortage Index
- Job Openings: 122,000
- Unemployed Workers: 192,851
- Labor Force Participation Rate: 62.5
- Unemployment Rate: 4.7
- Quit Rate: 1.6
- Hiring Rate: 2.9
West Virginia
West Virginia has 80 available workers for every 100 open jobs.
Last updated December 2025
-
0.80
West Virginia's Worker Shortage Index
- Job Openings: 45,000
- Unemployed Workers: 35,777
- Labor Force Participation Rate: 54.6
- Unemployment Rate: 4.6
- Quit Rate: 2.7
- Hiring Rate: 3.6
Wisconsin
Wisconsin has 75 available workers for every 100 open jobs.
Last updated December 2025
-
0.75
Wisconsin's Worker Shortage Index
- Job Openings: 130,000
- Unemployed Workers: 97,555
- Labor Force Participation Rate: 64.2
- Unemployment Rate: 3.1
- Quit Rate: 2.0
- Hiring Rate: 3.3
Wyoming
Wyoming has 71 available workers for every 100 open jobs.
Last updated December 2025
-
0.71
Wyoming's Worker Shortage Index
- Job Openings: 14,000
- Unemployed Workers: 9,914
- Labor Force Participation Rate: 61.3
- Unemployment Rate: 3.4
- Quit Rate: 1.7
- Hiring Rate: 4.7
While the national Worker Shortage Index average is 1.0 (100 available workers for every 100 open jobs), this ratio varies across different state and industries and is largely being pulled up by only a handful of states. The majority of states have a Worker Shortage Index of less than 0.90 as many states face challenges filling their open jobs.
It is important to note that a labor surplus does not mean all positions will be occupied. as workers may not necessarily be located in the geographic areas—or may not have the skills or experience—for the industries where the open positions are situated.
America’s Workforce Barriers & Challenges
Shifting Demographics
One big challenge for workforce participation: the American workforce is aging. Following the Great Recession, birth rates in the U.S. experienced a decline, ultimately reaching a historic low in 2020. Unfortunately, these rates have not shown signs of recovery. This persistently low birth rate is causing the U.S. population to age at an accelerated rate.

In 2023 the number of Americans retiring hit record highs, while first grade enrollment is at an all-time low. There are fewer first grade students than high school seniors in 30 states. In 10 years, when those first graders begin entering the workforce, we will see a drop in available workers.
With Generation Z estimated to make up 30% of the workforce by 2030, there will also be a noticeable shift in attitudes towards work and work-life balance.
The High Cost of Childcare
Expensive and hard-to-find childcare is keeping thousands of parents out of the workforce. Nationwide, childcare can cost an average of $343 per week for one child in daycare. At this rate, in many cases it can make more sense for a parent to leave the workforce and handle childcare duties rather than pay for care. According to a 2020 U.S. Chamber of Commerce Foundation study, 58% of working parents reported leaving work because they could not find adequate childcare solutions.

When childcare challenges keep working parents home, it also negatively impacts businesses. Data shows business spend anywhere from $400 million to $3 billion a year on employee turnover costs. These accumulated costs even affect the economic growth of entire states. The estimated annual loss to states’ economies as a result of childcare challenges range between $165 million to north of $9 billion.

The Skills Mismatch
Further complicating the worker shortage is a major mismatch between today’s most in-demand skills (digital and data literacy) versus the skills that available workers have on their resumes. For example, despite the demand for talent in the technology, finance, and healthcare industries, degrees in these disciples are outpaced by other majors.
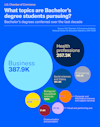
Additionally, entrepreneurial younger generations continue to find ways to contribute to the economy and workforce outside of traditional job roles. In 2024, 2 million content creators made at least six figures through social media.

Employers are responding quickly to the worker shortage, deploying new strategies to attract and retain a talented workforce. As the labor market continues to shift, and workers obtain new skills to gain employment in different industries, our labor pools take different shapes.
Through the America Works Initiative, we’re helping employers across the country develop and discover talent to fill open jobs and grow our economy.
For more information on the America Works Initiative contact Stephanie Ferguson Melhorn at sferguson@uschamber.com.
About the authors
Stephanie Ferguson Melhorn
Stephanie Ferguson Melhorn is the Executive Director, Workforce and International Labor Policy. Her work on the labor shortage has been cited in the Wall Street Journal, Washington Post, and Associated Press.

Isabella Lucy
Isabella has created stunning visualizations tackling pressing issues like the worker shortage, the benefits of hiring veterans, the lifespan of small businesses, and the future of work.