Makinizi Hoover Makinizi Hoover
Senior Manager, Strategic Advocacy, U.S. Chamber of Commerce
Isabella Lucy Isabella Lucy
Graphic Designer, U.S. Chamber of Commerce
Stephanie Ferguson Stephanie Ferguson
Director, Global Employment Policy & Special Initiatives, U.S. Chamber of Commerce

Published

September 15, 2023

Share

The state of Missouri has a favorable landscape for businesses and individuals, with a diverse economy, exceedingly strong labor market recovery, and a robust small business ecosystem. Immigrants contribute meaningfully to the state's workforce and economy, while educational attainment, quality of life, and cost of living factors remain promising. 

The Worker Shortage Across America

Explore the interactive map below to see the impact of the worker shortage crisis in each state updated September 2023.

Least severe
Severe
More severe
Most severe

Alabama

Alabama has 38 available workers for every 100 open jobs.

  • 0.38
    Alabama's Worker Shortage Index
  • Job Openings: 129,000
  • Unemployed Workers: 48,590
  • Labor Force Participation Rate: 57.0
  • Unemployment Rate: 2.1
  • Quit Rate: 2.9
  • Hiring Rate: 4.5

Alaska

Alaska has 59 available workers for every 100 open jobs.

  • 0.59
    Alaska's Worker Shortage Index
  • Job Openings: 24,000
  • Unemployed Workers: 14,081
  • Labor Force Participation Rate: 65.2
  • Unemployment Rate: 3.9
  • Quit Rate: 3.4
  • Hiring Rate: 4.9

Arizona

Arizona has 71 available workers for every 100 open jobs.

  • 0.71
    Arizona's Worker Shortage Index
  • Job Openings: 199,000
  • Unemployed Workers: 141,617
  • Labor Force Participation Rate: 61.8
  • Unemployment Rate: 3.8
  • Quit Rate: 3.0
  • Hiring Rate: 4.0

Arkansas

Arkansas has 44 available workers for every 100 open jobs.

  • 0.44
    Arkansas's Worker Shortage Index
  • Job Openings: 84,000
  • Unemployed Workers: 37,339
  • Labor Force Participation Rate: 57.7
  • Unemployment Rate: 2.7
  • Quit Rate: 2.7
  • Hiring Rate: 4.3

California

California has 92 available workers for every 100 open jobs.

  • 0.92
    California's Worker Shortage Index
  • Job Openings: 975,000
  • Unemployed Workers: 895,044
  • Labor Force Participation Rate: 62.4
  • Unemployment Rate: 4.6
  • Quit Rate: 1.7
  • Hiring Rate: 3.4

Colorado

Colorado has 52 available workers for every 100 open jobs.

  • 0.52
    Colorado's Worker Shortage Index
  • Job Openings: 191,000
  • Unemployed Workers: 99,856
  • Labor Force Participation Rate: 68.7
  • Unemployment Rate: 3.1
  • Quit Rate: 2.3
  • Hiring Rate: 3.0

Connecticut

Connecticut has 74 available workers for every 100 open jobs.

  • 0.74
    Connecticut's Worker Shortage Index
  • Job Openings: 91,000
  • Unemployed Workers: 67,253
  • Labor Force Participation Rate: 64.1
  • Unemployment Rate: 3.5
  • Quit Rate: 2.0
  • Hiring Rate: 3.6

Delaware

Delaware has 63 available workers for every 100 open jobs.

  • 0.63
    Delaware's Worker Shortage Index
  • Job Openings: 33,000
  • Unemployed Workers: 20,812
  • Labor Force Participation Rate: 60.3
  • Unemployment Rate: 4.1
  • Quit Rate: 3.1
  • Hiring Rate: 5.4

District of Columbia

District of Columbia has 45 available workers for every 100 open jobs.

  • 0.45
    District of Columbia's Worker Shortage Index
  • Job Openings: 43,000
  • Unemployed Workers: 19,519
  • Labor Force Participation Rate: 70.9
  • Unemployment Rate: 5.0
  • Quit Rate: 2.1
  • Hiring Rate: 3.4

Florida

Florida has 53 available workers for every 100 open jobs.

  • 0.53
    Florida's Worker Shortage Index
  • Job Openings: 570,000
  • Unemployed Workers: 302,949
  • Labor Force Participation Rate: 59.7
  • Unemployment Rate: 2.7
  • Quit Rate: 2.8
  • Hiring Rate: 4.0

Georgia

Georgia has 54 available workers for every 100 open jobs.

  • 0.54
    Georgia's Worker Shortage Index
  • Job Openings: 323,000
  • Unemployed Workers: 174,106
  • Labor Force Participation Rate: 61.4
  • Unemployment Rate: 3.3
  • Quit Rate: 2.9
  • Hiring Rate: 4.8
  • Top Employer Industry: Trade, Transportation, and Utilities

Learn more: Understanding Georgia’s Labor Market

Hawaii

Hawaii has 58 available workers for every 100 open jobs.

  • 0.58
    Hawaii's Worker Shortage Index
  • Job Openings: 33,000
  • Unemployed Workers: 19,024
  • Labor Force Participation Rate: 60.2
  • Unemployment Rate: 2.8
  • Quit Rate: 1.9
  • Hiring Rate: 3.3

Idaho

Idaho has 53 available workers for every 100 open jobs.

  • 0.53
    Idaho's Worker Shortage Index
  • Job Openings: 55,000
  • Unemployed Workers: 28,947
  • Labor Force Participation Rate: 62.4
  • Unemployment Rate: 3.0
  • Quit Rate: 2.9
  • Hiring Rate: 4.5

Illinois

Illinois has 76 available workers for every 100 open jobs.

  • 0.76
    Illinois's Worker Shortage Index
  • Job Openings: 349,000
  • Unemployed Workers: 266,155
  • Labor Force Participation Rate: 64.4
  • Unemployment Rate: 4.1
  • Quit Rate: 1.8
  • Hiring Rate: 3.4

Indiana

Indiana has 72 available workers for every 100 open jobs.

  • 0.72
    Indiana's Worker Shortage Index
  • Job Openings: 162,000
  • Unemployed Workers: 117,400
  • Labor Force Participation Rate: 63.5
  • Unemployment Rate: 3.4
  • Quit Rate: 2.6
  • Hiring Rate: 4.2
  • Top Employer Industry: Trade, Transportation, and Utilities

Learn more: Understanding Indiana’s Labor Market

Iowa

Iowa has 67 available workers for every 100 open jobs.

  • 0.67
    Iowa's Worker Shortage Index
  • Job Openings: 75,000
  • Unemployed Workers: 50,242
  • Labor Force Participation Rate: 68.7
  • Unemployment Rate: 2.9
  • Quit Rate: 2.4
  • Hiring Rate: 3.3

Kansas

Kansas has 51 available workers for every 100 open jobs.

  • 0.51
    Kansas's Worker Shortage Index
  • Job Openings: 82,000
  • Unemployed Workers: 41,743
  • Labor Force Participation Rate: 66.7
  • Unemployment Rate: 2.7
  • Quit Rate: 2.1
  • Hiring Rate: 3.9

Kentucky

Kentucky has 74 available workers for every 100 open jobs.

  • 0.74
    Kentucky's Worker Shortage Index
  • Job Openings: 111,000
  • Unemployed Workers: 82,001
  • Labor Force Participation Rate: 57.6
  • Unemployment Rate: 4.0
  • Quit Rate: 2.9
  • Hiring Rate: 4.1

Louisiana

Louisiana has 55 available workers for every 100 open jobs.

  • 0.55
    Louisiana's Worker Shortage Index
  • Job Openings: 126,000
  • Unemployed Workers: 68,804
  • Labor Force Participation Rate: 59.0
  • Unemployment Rate: 3.3
  • Quit Rate: 3.0
  • Hiring Rate: 5.7

Maine

Maine has 42 available workers for every 100 open jobs.

  • 0.42
    Maine's Worker Shortage Index
  • Job Openings: 41,000
  • Unemployed Workers: 17,148
  • Labor Force Participation Rate: 58.6
  • Unemployment Rate: 2.5
  • Quit Rate: 1.7
  • Hiring Rate: 3.6

Maryland

Maryland has 33 available workers for every 100 open jobs.

  • 0.33
    Maryland's Worker Shortage Index
  • Job Openings: 165,000
  • Unemployed Workers: 54,778
  • Labor Force Participation Rate: 65.3
  • Unemployment Rate: 1.7
  • Quit Rate: 2.3
  • Hiring Rate: 4.0

Massachusetts

Massachusetts has 42 available workers for every 100 open jobs.

  • 0.42
    Massachusetts's Worker Shortage Index
  • Job Openings: 236,000
  • Unemployed Workers: 98,262
  • Labor Force Participation Rate: 64.5
  • Unemployment Rate: 2.6
  • Quit Rate: 1.3
  • Hiring Rate: 3.2

Michigan

Michigan has 85 available workers for every 100 open jobs.

  • 0.85
    Michigan's Worker Shortage Index
  • Job Openings: 216,000
  • Unemployed Workers: 183,249
  • Labor Force Participation Rate: 61.3
  • Unemployment Rate: 3.7
  • Quit Rate: 2.1
  • Hiring Rate: 3.7

Minnesota

Minnesota has 51 available workers for every 100 open jobs.

  • 0.51
    Minnesota's Worker Shortage Index
  • Job Openings: 192,000
  • Unemployed Workers: 97,053
  • Labor Force Participation Rate: 68.5
  • Unemployment Rate: 3.1
  • Quit Rate: 2.3
  • Hiring Rate: 3.5
  • Top Employer Industry: Education and Health Services

Learn more: Understanding Minnesota’s Labor Market

Mississippi

Mississippi has 49 available workers for every 100 open jobs.

  • 0.49
    Mississippi's Worker Shortage Index
  • Job Openings: 80,000
  • Unemployed Workers: 39,159
  • Labor Force Participation Rate: 54.3
  • Unemployment Rate: 3.2
  • Quit Rate: 3.2
  • Hiring Rate: 4.9
  • Top Employer Industry: Trade, Transportation, and Utilities

Learn more: Understanding Mississippi’s Labor Market

Missouri

Missouri has 53 available workers for every 100 open jobs.

  • 0.53
    Missouri's Worker Shortage Index
  • Job Openings: 167,000
  • Unemployed Workers: 87,977
  • Labor Force Participation Rate: 63.7
  • Unemployment Rate: 2.8
  • Quit Rate: 2.2
  • Hiring Rate: 3.3
  • Top Employer Industry: Trade, Transportation, and Utilities

Learn more: Understanding Missouri’s Labor Market

Montana

Montana has 42 available workers for every 100 open jobs.

  • 0.42
    Montana's Worker Shortage Index
  • Job Openings: 35,000
  • Unemployed Workers: 14,691
  • Labor Force Participation Rate: 62.7
  • Unemployment Rate: 2.5
  • Quit Rate: 3.1
  • Hiring Rate: 4.8

Nebraska

Nebraska has 39 available workers for every 100 open jobs.

  • 0.39
    Nebraska's Worker Shortage Index
  • Job Openings: 54,000
  • Unemployed Workers: 21,145
  • Labor Force Participation Rate: 69.2
  • Unemployment Rate: 2.0
  • Quit Rate: 2.3
  • Hiring Rate: 3.6

Nevada

Nevada has 93 available workers for every 100 open jobs.

  • 0.93
    Nevada's Worker Shortage Index
  • Job Openings: 92,000
  • Unemployed Workers: 85,620
  • Labor Force Participation Rate: 61.7
  • Unemployment Rate: 5.4
  • Quit Rate: 2.6
  • Hiring Rate: 4.1

New Hampshire

New Hampshire has 28 available workers for every 100 open jobs.

  • 0.28
    New Hampshire's Worker Shortage Index
  • Job Openings: 50,000
  • Unemployed Workers: 13,782
  • Labor Force Participation Rate: 64.6
  • Unemployment Rate: 1.8
  • Quit Rate: 2.1
  • Hiring Rate: 4.2
  • Top Employer Industry: Trade, Transportation, and Utilities

Learn more: Understanding New Hampshire’s Labor Market

New Jersey

New Jersey has 84 available workers for every 100 open jobs.

  • 0.84
    New Jersey's Worker Shortage Index
  • Job Openings: 243,000
  • Unemployed Workers: 203,340
  • Labor Force Participation Rate: 65.5
  • Unemployment Rate: 4.2
  • Quit Rate: 2.1
  • Hiring Rate: 3.4

New Mexico

New Mexico has 55 available workers for every 100 open jobs.

  • 0.55
    New Mexico's Worker Shortage Index
  • Job Openings: 65,000
  • Unemployed Workers: 35,840
  • Labor Force Participation Rate: 57.2
  • Unemployment Rate: 3.7
  • Quit Rate: 2.4
  • Hiring Rate: 4.5

New York

New York has 87 available workers for every 100 open jobs.

  • 0.87
    New York's Worker Shortage Index
  • Job Openings: 441,000
  • Unemployed Workers: 384,655
  • Labor Force Participation Rate: 61.5
  • Unemployment Rate: 3.9
  • Quit Rate: 1.4
  • Hiring Rate: 3.0

North Carolina

North Carolina has 55 available workers for every 100 open jobs.

  • 0.55
    North Carolina's Worker Shortage Index
  • Job Openings: 316,000
  • Unemployed Workers: 173,531
  • Labor Force Participation Rate: 60.8
  • Unemployment Rate: 3.3
  • Quit Rate: 2.7
  • Hiring Rate: 3.7

North Dakota

North Dakota has 30 available workers for every 100 open jobs.

  • 0.30
    North Dakota's Worker Shortage Index
  • Job Openings: 26,000
  • Unemployed Workers: 7,890
  • Labor Force Participation Rate: 69.5
  • Unemployment Rate: 1.9
  • Quit Rate: 2.5
  • Hiring Rate: 3.9

Ohio

Ohio has 62 available workers for every 100 open jobs.

  • 0.62
    Ohio's Worker Shortage Index
  • Job Openings: 314,000
  • Unemployed Workers: 195,642
  • Labor Force Participation Rate: 62.1
  • Unemployment Rate: 3.4
  • Quit Rate: 2.4
  • Hiring Rate: 3.4

Oklahoma

Oklahoma has 52 available workers for every 100 open jobs.

  • 0.52
    Oklahoma's Worker Shortage Index
  • Job Openings: 104,000
  • Unemployed Workers: 54,368
  • Labor Force Participation Rate: 61.8
  • Unemployment Rate: 2.8
  • Quit Rate: 2.9
  • Hiring Rate: 4.9

Oregon

Oregon has 66 available workers for every 100 open jobs.

  • 0.66
    Oregon's Worker Shortage Index
  • Job Openings: 111,000
  • Unemployed Workers: 73,506
  • Labor Force Participation Rate: 61.7
  • Unemployment Rate: 3.4
  • Quit Rate: 2.3
  • Hiring Rate: 3.5

Pennsylvania

Pennsylvania has 66 available workers for every 100 open jobs.

  • 0.66
    Pennsylvania's Worker Shortage Index
  • Job Openings: 342,000
  • Unemployed Workers: 226,208
  • Labor Force Participation Rate: 61.9
  • Unemployment Rate: 3.5
  • Quit Rate: 2.0
  • Hiring Rate: 2.9

Rhode Island

Rhode Island has 53 available workers for every 100 open jobs.

  • 0.53
    Rhode Island's Worker Shortage Index
  • Job Openings: 29,000
  • Unemployed Workers: 15,232
  • Labor Force Participation Rate: 63.3
  • Unemployment Rate: 2.7
  • Quit Rate: 1.8
  • Hiring Rate: 3.9

South Carolina

South Carolina has 43 available workers for every 100 open jobs.

  • 0.43
    South Carolina's Worker Shortage Index
  • Job Openings: 168,000
  • Unemployed Workers: 73,016
  • Labor Force Participation Rate: 57.0
  • Unemployment Rate: 3.0
  • Quit Rate: 3.0
  • Hiring Rate: 4.3

South Dakota

South Dakota has 36 available workers for every 100 open jobs.

  • 0.36
    South Dakota's Worker Shortage Index
  • Job Openings: 25,000
  • Unemployed Workers: 9,073
  • Labor Force Participation Rate: 67.8
  • Unemployment Rate: 1.9
  • Quit Rate: 2.6
  • Hiring Rate: 3.9

Tennessee

Tennessee has 56 available workers for every 100 open jobs.

  • 0.56
    Tennessee's Worker Shortage Index
  • Job Openings: 189,000
  • Unemployed Workers: 105,102
  • Labor Force Participation Rate: 59.4
  • Unemployment Rate: 3.1
  • Quit Rate: 2.9
  • Hiring Rate: 4.8

Texas

Texas has 80 available workers for every 100 open jobs.

  • 0.80
    Texas's Worker Shortage Index
  • Job Openings: 774,000
  • Unemployed Workers: 622,845
  • Labor Force Participation Rate: 64.2
  • Unemployment Rate: 4.1
  • Quit Rate: 2.7
  • Hiring Rate: 3.8

Utah

Utah has 44 available workers for every 100 open jobs.

  • 0.44
    Utah's Worker Shortage Index
  • Job Openings: 105,000
  • Unemployed Workers: 45,772
  • Labor Force Participation Rate: 69.8
  • Unemployment Rate: 2.5
  • Quit Rate: 2.8
  • Hiring Rate: 3.7
  • Top Employer Industry: Trade, Transportation, and Utilities

Learn more: Understanding Utah’s Labor Market

Vermont

Vermont has 36 available workers for every 100 open jobs.

  • 0.36
    Vermont's Worker Shortage Index
  • Job Openings: 18,000
  • Unemployed Workers: 6,407
  • Labor Force Participation Rate: 64.0
  • Unemployment Rate: 1.8
  • Quit Rate: 2.3
  • Hiring Rate: 3.6
  • Top Employer Industry: Education and Health Services

Learn more: Understanding Vermont’s Labor Market

Virginia

Virginia has 47 available workers for every 100 open jobs.

  • 0.47
    Virginia's Worker Shortage Index
  • Job Openings: 243,000
  • Unemployed Workers: 113,102
  • Labor Force Participation Rate: 66.7
  • Unemployment Rate: 2.5
  • Quit Rate: 2.6
  • Hiring Rate: 4.3
  • Top Employer Industry: Professional and Business Services

Learn more: Understanding Virginia’s Labor Market

Washington

Washington has 77 available workers for every 100 open jobs.

  • 0.77
    Washington's Worker Shortage Index
  • Job Openings: 189,000
  • Unemployed Workers: 145,895
  • Labor Force Participation Rate: 64.6
  • Unemployment Rate: 3.6
  • Quit Rate: 2.2
  • Hiring Rate: 3.4

West Virginia

West Virginia has 54 available workers for every 100 open jobs.

  • 0.54
    West Virginia's Worker Shortage Index
  • Job Openings: 52,000
  • Unemployed Workers: 28,256
  • Labor Force Participation Rate: 54.9
  • Unemployment Rate: 3.6
  • Quit Rate: 3.3
  • Hiring Rate: 5.1

Wisconsin

Wisconsin has 54 available workers for every 100 open jobs.

  • 0.54
    Wisconsin's Worker Shortage Index
  • Job Openings: 165,000
  • Unemployed Workers: 89,517
  • Labor Force Participation Rate: 65.7
  • Unemployment Rate: 2.9
  • Quit Rate: 2.3
  • Hiring Rate: 3.3

Wyoming

Wyoming has 46 available workers for every 100 open jobs.

  • 0.46
    Wyoming's Worker Shortage Index
  • Job Openings: 19,000
  • Unemployed Workers: 8,739
  • Labor Force Participation Rate: 64.5
  • Unemployment Rate: 2.9
  • Quit Rate: 3.1
  • Hiring Rate: 4.5

The Chamber’s Worker Shortage Index ratio indicates the number of available workers for every job opening. A ratio above 1.0 indicates a surplus of available workers compared to job openings.

Missouri’s Labor Market 

Prior to the pandemic, Missouri’s labor market was healthy. While the state's unemployment rate stood on par with the national figure at 3.4%, its labor force participation rate was slightly higher than the national rate of 63.4%. There were 85 available workers for every 100 open jobs.

As of August 2023, Missouri’s labor market was nearly fully recovered, with some metrics measuring even better than they did prior to the pandemic. Missouri’s labor force participation rate is at pre-pandemic levels and the unemployment rate remains lower than it was before the pandemic, and a point below the national average.

On the downside, Missouri is grappling with a large workforce shortage, evident by the fact that there are only 53 available workers for every 100 open job positions in the Show Me State. 

Missouri’s Business Environment 

Missouri's business environment is diverse, with a robust agriculture and forestry sector, a growing tech industry, and numerous colleges and universities. Additionally, the state is home to nearly a dozen Fortune 500 company headquarters. 

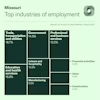
Among the industries monitored by the Bureau of Labor Statistics, the trade, transportation, and utilities sector, as well as the education and health services sector, employ the highest number of Missourians, while the construction sector employs the fewest. Missouri’s employment landscape comes from its numerous healthcare firms, in addition to the many automotive and aviation companies which operate in the state. 

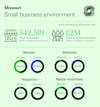
Missouri boasts a thriving small business ecosystem, with 99.4% of all Missouri businesses falling into this category. Nearly half of Missouri's workforce works within small businesses. Within this dynamic landscape, women own 43% of small businesses, 10.5% are minority-owned, 2.3% are owned by Hispanics, and 8.3% are veteran-owned. 

Missouri’s Educational Attainment 

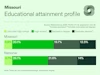
Around 92% of Missouri’s population has obtained their high school diploma or its equivalent, two percentage points higher than the national average in 2022. Nearly a third of the population has attained a bachelor's degree, while 12.5% have secured a graduate degree, both slightly below the national averages. 

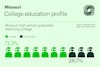
Fortunately for employers in the state, the majority of Missouri college freshmen are remaining in the state for their higher education, where the average in-state tuition is $8,992. Out-of-state tuition in Missouri is $20,877, which is significantly less than the average out-of-state tuition of $28,000. Roughly 360,000 undergraduate students are enrolled in a Missouri college for the 2022-2023 school year.  These students supply a rich talent pool from which local employers can recruit talent.  

Quality of Life 

Missouri Income Profile

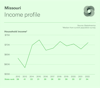
Missouri's median household income mirrors the national average of around $70,000, which places the state at the 34th rank among all states. Missouri has a progressive tax system, with tax rates varying from 1.5% to 5.3% across nine income brackets. This places the state among those with relatively lower state tax rates. 

A quarter of Missouri’s workforce work remote at least one day a week. For those commuting into an office, the average commute time is 23.9 minutes. The Council for Community and Economic Research measures states’ costs of living compared to the national average of 100. Missouri’s cost of living index falls at 88.4, making the state more affordable than the U.S. average, with the fourth lowest cost of living in the United States. The median rent settles at $843, while the median home cost is $239,743, both falling beneath the national average. Nearly 67.6% of the population owned their housing unit in 2021. The state experienced a minimal growth rate of 0.4% from 2020 to 2022.  

Immigration 

Missouri's Immigration fact sheet

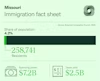
In the U.S., immigrants tend to be of working age in comparison to native-born individuals. As workers, these immigrants are also contributing to support programs like Medicare and Social Security.

Looking at Missouri in particular, immigrants comprise 4.2% of the state's population, totaling 258,741 individuals. Their collective spending power amounts to $7.2 billion, while their tax contributions reach $2.5 billion. 

About the authors

Makinizi Hoover

Makinizi Hoover

Makinizi Hoover is the Senior Manager of Strategic Advocacy at the U.S. Chamber of Commerce. Her work includes the development and project management of comprehensive data centers that serve as a valuable resource for policymakers, businesses, and the public.

Read more

Isabella Lucy

Isabella Lucy

Isabella has created stunning visualizations tackling pressing issues like the worker shortage, the benefits of hiring veterans, the lifespan of small businesses, and the future of work.

Read more

Stephanie Ferguson

Stephanie Ferguson

Stephanie Ferguson is the Director of Global Employment Policy & Special Initiatives. Her work on the labor shortage has been cited in the Wall Street Journal, Washington Post, and Associated Press.

Read more